Our “Off The Wall” Blog
is now Monument #Unfiltered
Subscribe below to receive our unique, straight-forward, unfiltered wealth advice delivered straight to your inbox.
2016 – HERE’S WHAT HAPPENED

Despite the nice post-election rally to end 2016, it turned out to be downright…average.
That is if you use the S&P 500 Index as your yardstick.
If you go back to 1928, the average annual return for the S&P 500 (including reinvested dividends) runs just around 10%. 2016 turned in the year with the S&P 500 up 9.54% on a price return basis. Throw in the dividends and it was up 11.96%. The mid-cap and smaller company indexes were up over 20%.
Since the bull market began in early 2009, we’ve been treated to eight-straight years of positive returns for the S&P 500 Index (dividends included), with six of those in double digits. That has a lot of investors wondering if we’re near a top.
I’ll get there in a few minutes…keep reading.
But First, a Look Back at 2016
Looking at the S&P 500 on a point-to-point basis, 2016 was a good year. However, point-to-point masks some major intra-year swings. Read: “Why the Market is Whipsawing”
For the most part, 2016 can be broken down into four distinct periods.
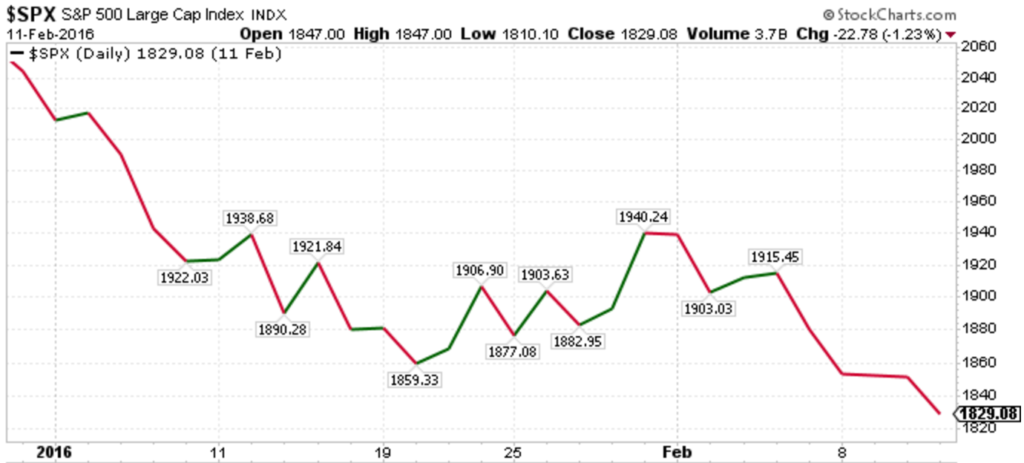
First, the Recession Fear
We started out the year with the specter of four projected rate hikes, poor U.S. economic reports and uproar over a possible Chinese slowdown. This caused the nastiest first two weeks of the year for the S&P 500…ever. Seriously. 2016, with a return of 9.54% to 11.96% (depending on what you did with the dividends) started out as the WORST FIRST TWO WEEKS EVER RECORDED.
Then, by mid-February, the S&P 500 was down 10% for the year while the Barclay’s U.S. Long Term Treasury Index was up 10%. Oh, and don’t forget oil hitting a 13-year low. The Chinese market? Well, the Shanghai Composite fell around 25%.
Here’s how it looked from January 1st, 2016 through February 11th, 2016.
From There…a Recovery
The next period of 2016 can be marked by the day that the shit was fully hitting the fan and came out the other side…February 11th.
One day later, with the fan still running, it was reported that Jamie Dimon bought somewhere around $27 million of JP Morgan Chase (JPM). He’s the guy who runs JPM in case you didn’t recognize his name…Let’s hope he got a negotiated rate on the commissions.
From there, it seems like investors started believing that the Fed was not going to raise rates given the market turmoil or the previous 5-6 weeks and that a global recession was not in the cards.
By the middle of March, both the S&P 500 and oil (using the WTI) were positive on the year, and we continued to the end of June.
Here’s how this period of time looked.
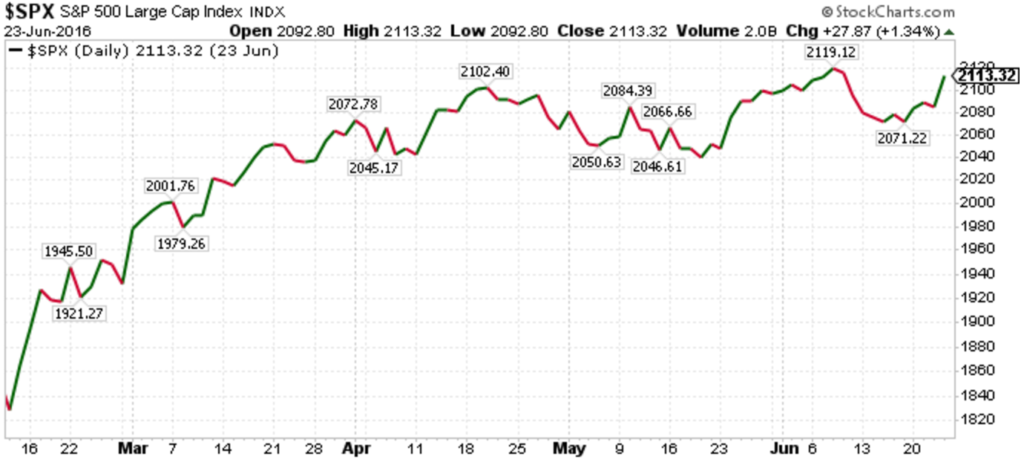
Those are very different charts.
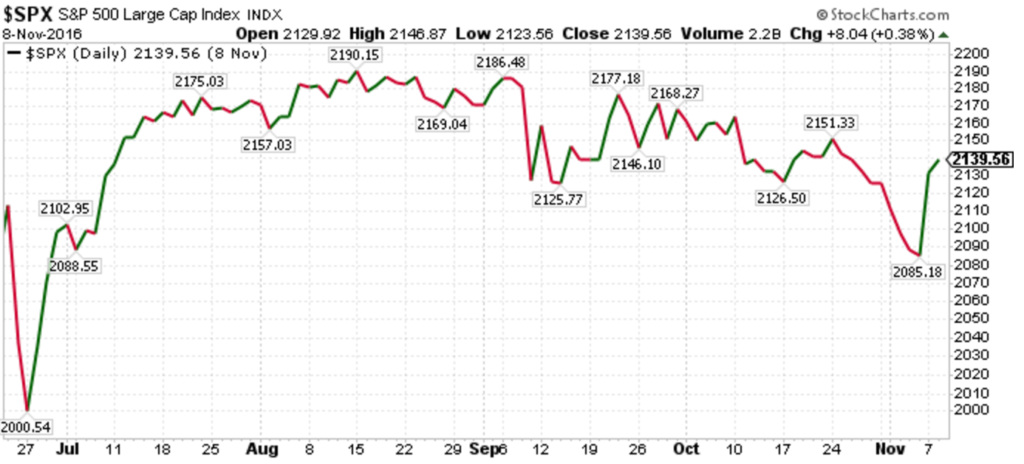
Then We Had Brexit and Its Aftermath
The market continued its shifting until Brexit (or more accurately, the British electorate) shocked the world…and the news agencies…and the pollsters…and, well, everyone) on June 23rd by voting to leave the European Union.
Read: “Special Report – Brexit”
Wow. It will be hard to forget the day. And the day after. Thankfully, it was a weekend.
However, when markets started trading we saw the S&P 500 get crushed to the tune of -5.3% over two days. However, even after the British pound hit a 31-year low and the U.S. 10-year Treasury yield fell to its lowest level since at least 1962, the S&P 500 quickly began to…wait for it…RECOVER! And by July 11th, it had moved to print a close that was a record high.
From that point, the S&P 500 pretty much languished, but bonds started to recover. The most interesting part of the year was the spike up in the day leading up to the election with almost every poll predicting a Clinton win.
Though not without excitement, point-to-point, this part of the year was pretty flat. Here’s how it looked.
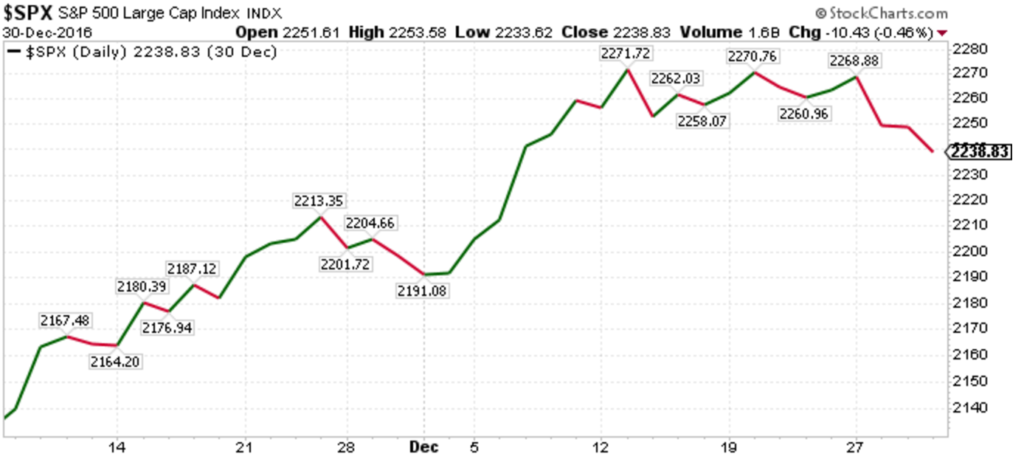
Until…
The DJT Rally
New highs experienced by the major U.S. indexes came despite the unexpected victory by Donald Trump. Most analysts believed a brief but violent selloff would ensue if the outsider won the election. Instead, talk of corporate and individual tax cuts, new spending on infrastructure, the repeal of Obamacare, and regulatory reform all served to spark a late-year rally…the S&P 500 jumped almost 5% from election day through the end of the year.
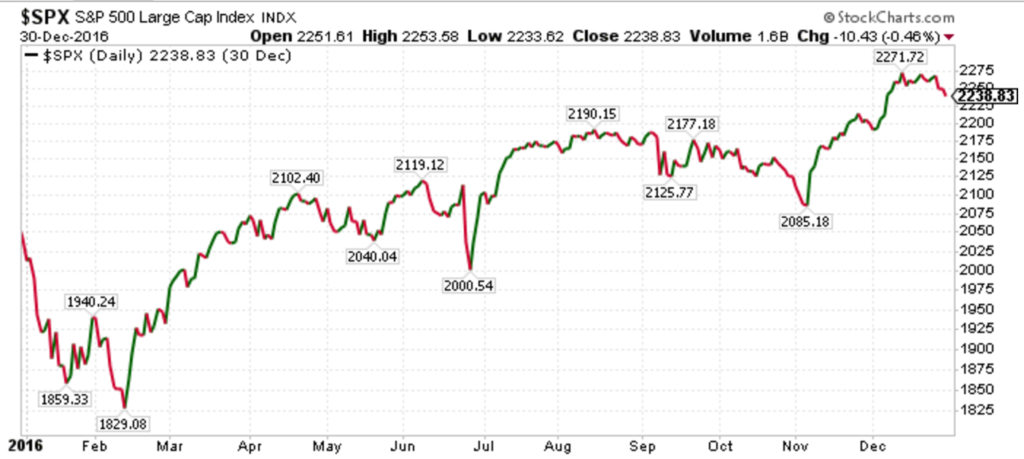
Here’s how this part of the year looked.
As I stated earlier, the year ended with the S&P 500 up around 10%. When you take it all in, the rocky year that was 2017 looked like this.
What’s in Store for 2017?
Forecasting how stocks will perform any year is dicey business. Simply put, there are too many moving parts to the stock price equation, and each of those moving parts can affect one of the other moving parts.
But it’s always an interesting cerebral exercise to take a stab at some of the tailwinds and risks.
Since WWII, the U.S. economy has had 11 economic expansions. At 73 months, the current expansion is the fourth longest, with the longest being 120 months.
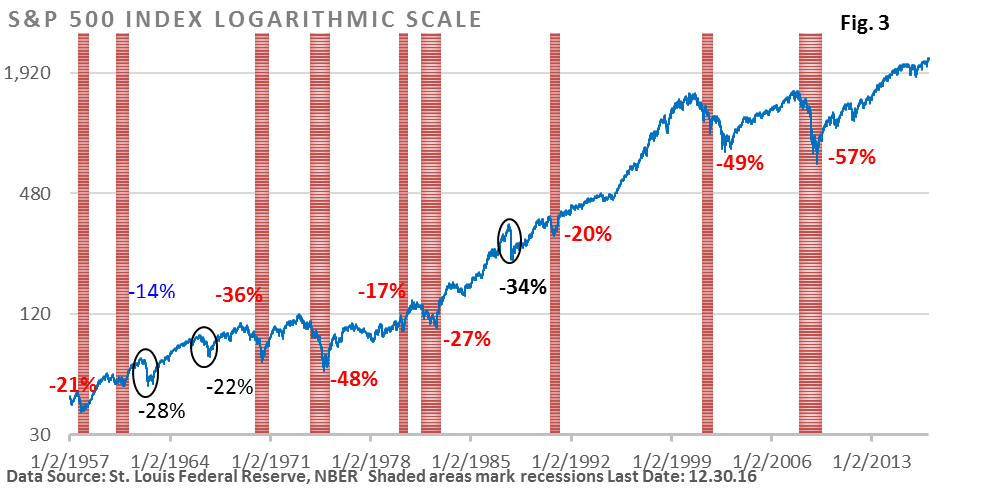
The current recovery isn’t young anymore, but risks for a near-term recession in the U.S. are low. That’s important for investors because Figure 3, below, reveals that most bear markets, defined as a 20% decline, since the late 1950’s were associated with a recession. The one most recent exception was the Crash of 1987.
Thomson Reuters is forecasting a return to S&P 500 profit growth in 2017, which would provide a tailwind for stocks. A gradual upward path in interest rates by the Fed would probably be viewed as a plus, especially if it were in response to an expanding economy.
Trump’s election sparked enthusiasm, primarily because he has touted pro-growth policies and downplayed his more controversial ideas. For example, it’s unknown if his tough trade talk during the election will result in dramatic new barriers to free trade or whether his rhetoric is simply a negotiating ploy.
Of course, there are other unknowns. Will simmering problems in Europe or China bubble to the surface, or will unexpected geopolitical issues surprise investors?
What we have seen during this cycle – problems abroad that have not had a material impact on the U.S. economy– have created temporary angst, but have not killed the current bull market.
Another way to view this? Those who have adhered to a long-range view and side-stepped the inevitable gyrations have profited.
Call with questions.

Important Disclosure Information
Please remember that past performance may not be indicative of future results. Different types of investments involve varying degrees of risk, and there can be no assurance that the future performance of any specific investment, investment strategy, or product (including the investments and/or investment strategies recommended or undertaken by Monument Wealth Management), or any non-investment related content, made reference to directly or indirectly in this blog will be profitable, equal any corresponding indicated historical performance level(s), be suitable for your portfolio or individual situation, or prove successful. All indexes referenced are unmanaged and cannot be invested into directly. The economic forecasts set forth may not develop as predicted. Due to various factors, including changing market conditions and/or applicable laws, the content may no longer be reflective of current opinions or positions. Moreover, you should not assume that any discussion or information contained in this blog serves as the receipt of, or as a substitute for, personalized investment advice from Monument Wealth Management. To the extent that a reader has any questions regarding the applicability of any specific issue discussed above to his/her individual situation, he/she is encouraged to consult with the professional advisor of his/her choosing. Monument Wealth Management is neither a law firm nor a certified public accounting firm and no portion of the blog content should be construed as legal or accounting advice. A copy of Monument Wealth Management’s current written disclosure statement discussing our advisory services and fees is available for review upon request.

David B. Armstrong, CFA
President & Co-Founder
Dave got into the industry when he discovered his passion for finance in his mid-20’s. He’s a combat veteran and served as an officer in the United States Marines Corps on both active duty and in the reserves, retiring at the rank of Lieutenant Colonel. While serving on active duty, Dave was unable to spend money on deployments, so he became a self-taught investor. Along with a few bucks cash as a bouncer, his investing performance grew to be good....
IMPORTANT DISCLOSURE INFORMATION
Please remember that past performance is no guarantee of future results. Different types of investments involve varying degrees of risk, and there can be no assurance that the future performance of any specific investment, investment strategy, or product (including the investments and/or investment strategies recommended or undertaken by Monument Capital Management, LLC [“Monument”]), or any non-investment related content, made reference to directly or indirectly in this blog will be profitable, equal any corresponding indicated historical performance level(s), be suitable for your portfolio or individual situation, or prove successful. Due to various factors, including changing market conditions and/or applicable laws, the content may no longer be reflective of current opinions or positions. Moreover, you should not assume that any discussion or information contained in this blog serves as the receipt of, or as a substitute for, personalized investment advice from Monument. To the extent that a reader has any questions regarding the applicability of any specific issue discussed above to his/her individual situation, he/she is encouraged to consult with the professional advisor of his/her choosing. No amount of prior experience or success should be construed that a certain level of results or satisfaction will be achieved if Monument is engaged, or continues to be engaged, to provide investment advisory services. Monument is neither a law firm nor a certified public accounting firm and no portion of the blog content should be construed as legal or accounting advice.
A copy of Monument’s current written disclosure Brochure discussing our advisory services and fees is available for review upon request or at www.monumentwealthmanagement.com/disclosures. Please Note: Monument does not make any representations or warranties as to the accuracy, timeliness, suitability, completeness, or relevance of any information prepared by any unaffiliated third party, whether linked to Monument’s website or blog or incorporated herein, and takes no responsibility for any such content. All such information is provided solely for convenience purposes only and all users thereof should be guided accordingly.
Historical performance results for investment indices, benchmarks, and/or categories have been provided for general informational/comparison purposes only, and generally do not reflect the deduction of transaction and/or custodial charges, the deduction of an investment management fee, nor the impact of taxes, the incurrence of which would have the effect of decreasing historical performance results. It should not be assumed that your Monument account holdings correspond directly to any comparative indices or categories. Please Also Note: (1) performance results do not reflect the impact of taxes; (2) comparative benchmarks/indices may be more or less volatile than your Monument accounts; and, (3) a description of each comparative benchmark/index is available upon request.
Please Remember: If you are a Monument client, please contact Monument, in writing, if there are any changes in your personal/financial situation or investment objectives for the purpose of reviewing/evaluating/revising our previous recommendations and/or services, or if you would like to impose, add, or to modify any reasonable restrictions to our investment advisory services. Unless, and until, you notify us, in writing, to the contrary, we shall continue to provide services as we do currently. Please Also Remember to advise us if you have not been receiving account statements (at least quarterly) from the account custodian.