I don’t think a recession is a 100% probability right now. Possible, sure. Probable? Ehhh, maybe…but more importantly, if there is one, I don’t think it’s right around the corner.
And that makes guessing a dangerous game.
As for the market last week, we needed about a 3.1% rally on Friday to break the seven straight weeks of the S&P 500 posting losses.
We clearly didn’t get it.
While I usually don’t re-report the financial news in this blog, I’m gonna do a quick recap for some context since it has been a very volatile year.
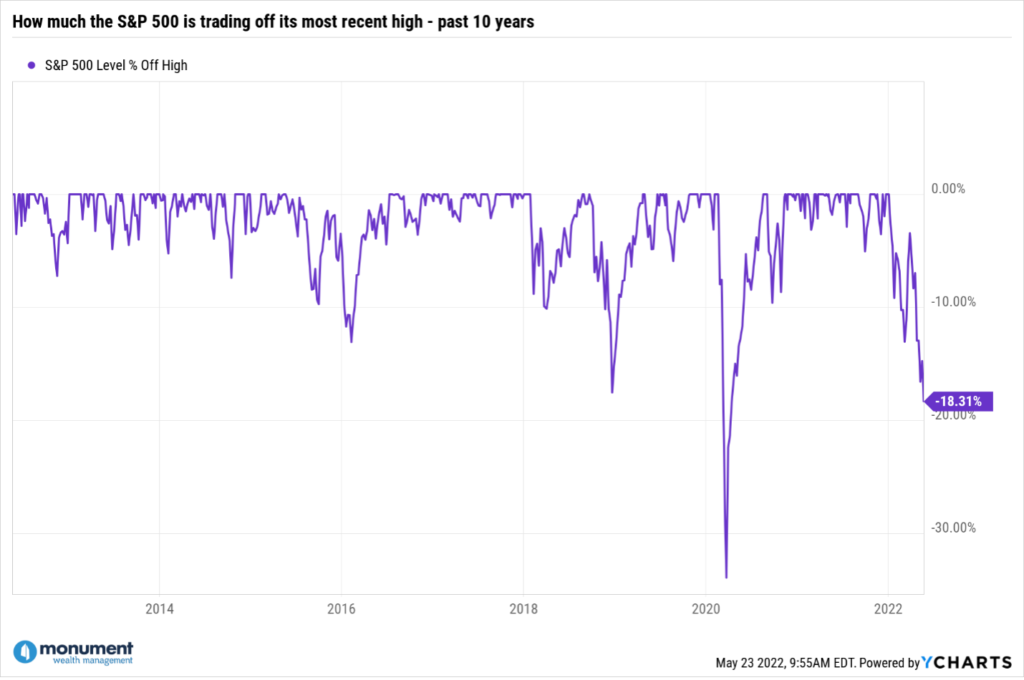
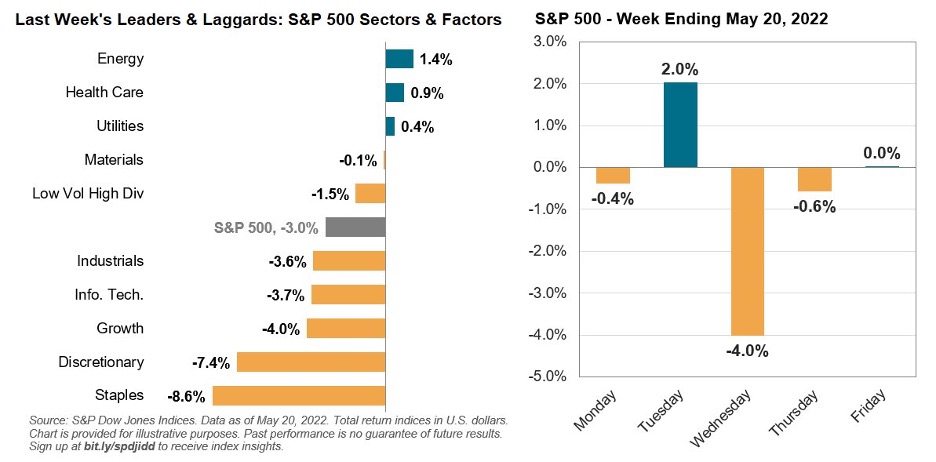
Last week the S&P 500 fell by about 3%, reaching lows that we have not seen since March of 2021. It also placed us right at the bear market territory threshold, commonly defined as any time the market loses 20% from its previous high.
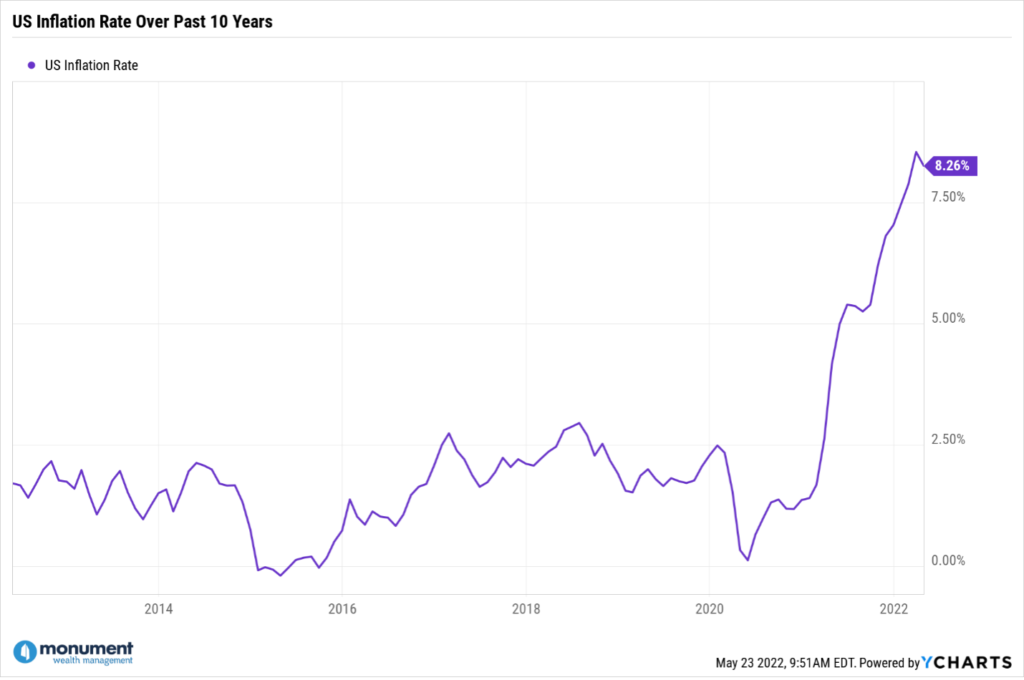
Most of last week’s sell-off was a function of disappointing quarterly earnings that came out of retailers causing investors to get concerned about the actual impacts of inflation on the economy.
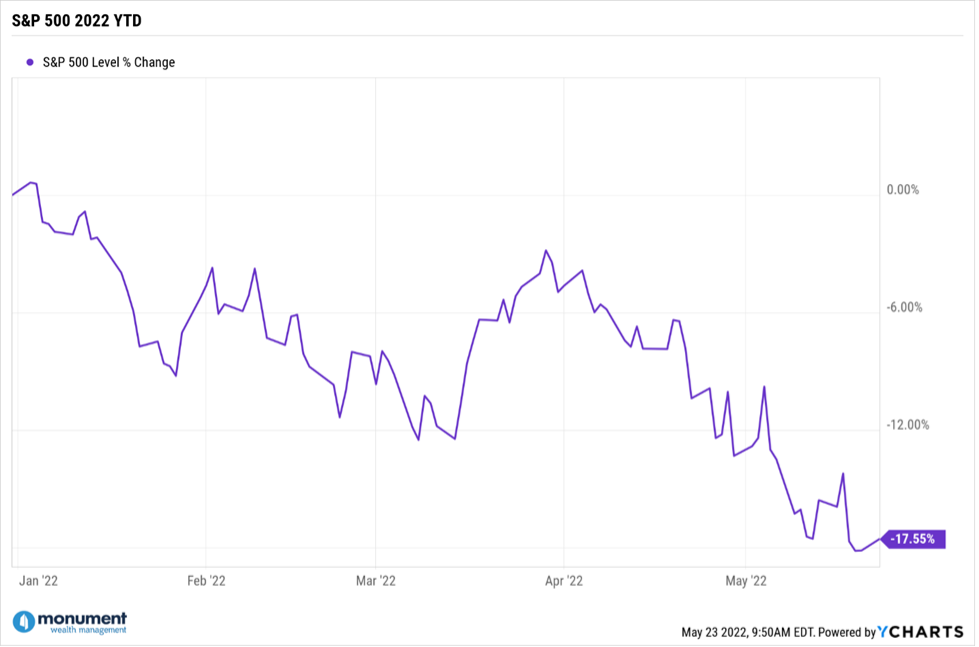
By the close on Friday, the S&P 500 benchmark was at 3,901. It is down 5.6% for May and has declined about 18% year-to-date. This marks the 7th consecutive week of losses for the index. For context, the S&P 500 has only had five losing streaks of seven weeks since 1928, and we haven’t had a single one since the eight-week slide that we saw ending March of 2001.
As mentioned, the decline was primarily a function of the latest quarterly reports from retailers. And the retailers are getting hammered this year – the worst year since 1990 (when we still had home phones that hung on the wall with a corded handset).
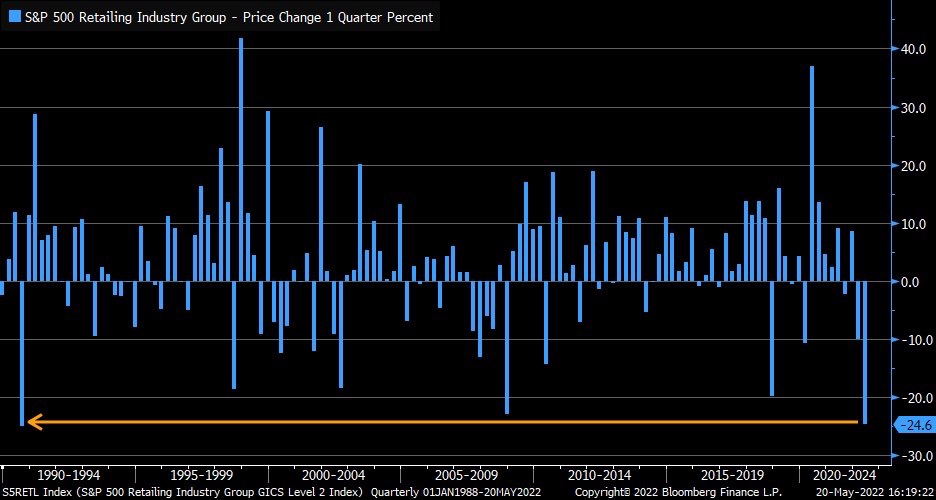
Walmart (WMT) and Target (TGT) specifically showed how much inflation was dragging down earnings.
Walmart adjusted its upcoming earnings due to concerns over supply chain disruptions, increased costs, and persistent inflationary pressure (mainly food and fuel).
Target also adjusted their earnings down based on what was described as unexpectedly high costs. Looking at the sectors that make up the S&P 500, the consumer stocks had the most significant decline of the week, with the Consumer Staples sector down 8.6% and the Consumer Discretionary sector down 7.4%. We saw the Technology sector fall about 3.8%, Industrials were down 3.7%, and the Communication Services lost 3%. Other sectors that were in the red were Real Estate, Financials and Materials.
Three sectors did post gains last week, but they were all very slight. Energy was up a little over 1%, Healthcare was up a little under 1%, and the Utility sector had about a 40 basis point gain.
Notably, Walmart was down 19% last week, Costco (COST) was down 16%, and Target was down 29%. Bath and Body Works (BBWI) was down 24% as people bought less soap. Go figure. The Energy sector’s advances were basically on the backs of crude oil and natural gas price increases.
Turn on the TV, and there is no shortage of people jibber-jabbering about all the causes of the sell-off, so I’ll throw in my $0.02 worth – this is nothing more than a hawkish Fed increasing worries over the potential for a recession.
Time will tell whether or not the S&P 500 will actually hit that -20% threshold, but I think it’s more probable that we cross it and then bounce off of it and recover from here. Although that has happened in the past – the last 2018 sell-off just BARELY escaped a technical bear market.
So, with the S&P 500 basically hitting the -20% threshold for a bear market, it’s worth taking a look at a few things.
First, it’s important to remember that no two bear markets will ever be exactly alike. Keep this in mind when you hear everyone on TV and in the news comparing this bear market to the bear market back in 2001 and 2002.
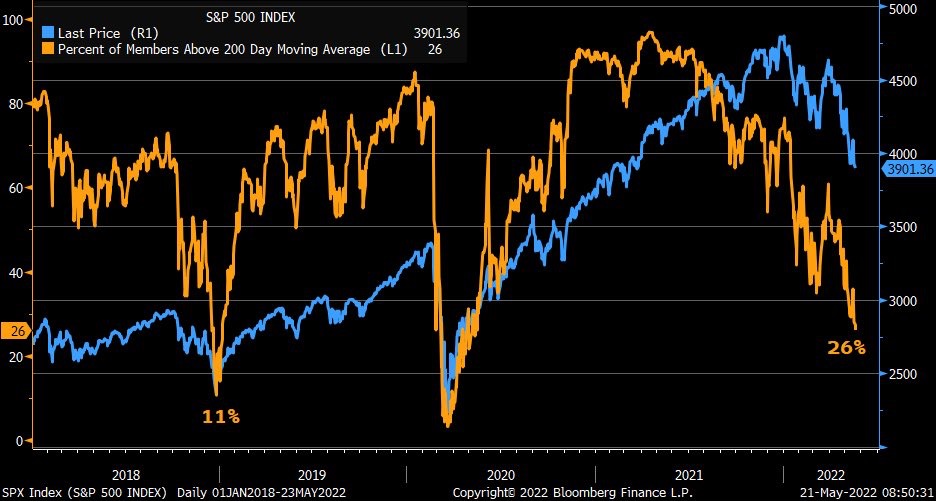
For example, comparing the current market to the aforementioned 2018 market, 26% of the stocks in the S&P 500 are trading above their 200-day moving average vs. only 11% in 2018.
Next is a chart from Bespoke Research that shows all of the bear markets in the post-WWII era.
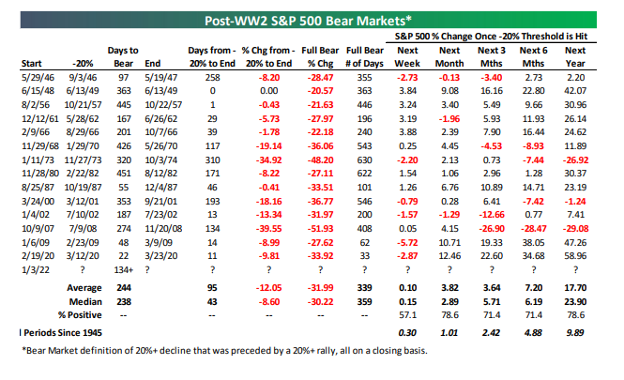
Of note are a few things. Again, while no two bear markets will ever be exactly the same, the Bespoke chart shows that on average, it takes the S&P 500 about 244 days to reach that 20% down threshold that defines a bear market.
As you can see, we are currently at just 130 days. So ostensibly, there’s still a lot of time left to hit that 20% threshold if you’re paying attention to the average.
Also, you will see in that chart that once the S&P 500 reaches the -20% mark, future returns tend to be better than average, especially over the next 12 months. It’s also interesting that in more than half of the 14 bear markets, the low was hit within two months of the 20% threshold being reached.
At this point, I would like to highlight that none of this is actionable. This is just data that I am presenting for some context and to manage any potential hysteria that may be coming through in mainstream media coverage of the markets. By that, I mean CNBC and Fox Business. Turn that shit off. No one is saying anything of substance on there, period. If you have to watch it, hit the mute button and just watch the market data.
Erin Hay here at Monument recently wrote, “Not all yield curve inversions proceed a recession, but all recessions are preceded by a yield curve inversion.”
I will twist that around a little bit and say that not all bear markets proceed a recession, but all recessions are preceded by a bear market.
Referring back to the previous chart of the 14 bear markets, eight preceded recessions while six did not.
Basically, what I’m pointing out here is there are bear markets that occur in isolation, and there are bear markets that proceed a recession – and I’m pointing that out because the data show that S&P 500 returns are much better in bear markets that occur in isolation rather than those that precede a recession. That may be obvious and not surprising, but it’s worth mentioning.
Mostly because I’m still not convinced that we are guaranteed a recession.
So what about all those predictions that we’re going to see a recession?
I’ve written about this recently and several times over the past few years. Here’s a notable blog from March of 2019 – read it to the end.
There are a ton of different things that people look at to try to forecast a recession. I look to stay out of the actual forecasting of a recession game and try to concentrate on the probability of a recession.
Specifically, is the probability INCREASING?
For that, I turned to our MONCON model and by looking at the percentage of yield curves currently inverted across all different combinations. I wrote about this in a previous blog that you can find here.
MONCON is still at 5.
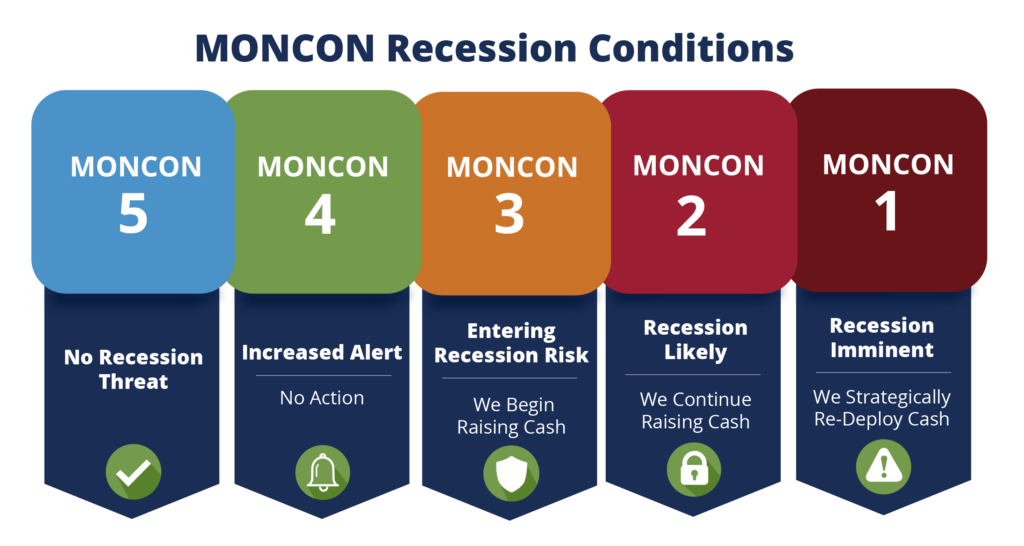
I know that “MONCON 5” sounds like a broken record but remember it is specifically designed not to whipsaw people back and forth. It is a tool to look at whether or not the probability of a recession taking place is increasing or decreasing.
I also recently wrote about how I felt it was better to look at the combination of 28 different U.S. treasury yield spreads rather than just look at the commonly referred to 2/7yr spread.
Of those 28 combinations, only one (ONE!) is inverted, which is the 10/7yr spread. Two others are hovering right at inversion (the 10/5yr and the 7/5yr), but what we know is that we need to see at least 22 of them inverted to make a recession call confidently.
Read that again – there is ONE, and there must be 22 for a confident recession prediction to be made. We are not even close.
None of this means we won’t HAVE a recession. It just means right now I don’t think we’re in one, and we’re not about to see one.
That last part is important because I think one of the most destructive things any investor can do is try to predict THE recession and trade in and out of cash around that. Remember this if you remember nothing else – I can predict A RECESSION with 100% certainty, while no one can accurately predict THE RECESSION. A point made by Dr. Daniel Crosby in this episode of our Off the Wall podcast.
Okay, fine, I know some people WILL NOT listen to that podcast, so I’ll do this – here’s his quote from the section I want you to hear:
So the other thing that I would say is intuition. We learn to trust our intuition because sometimes it works, and our intuition works in a very specific subset of times.
For intuition to work, it needs to be a decision that you A) make repeatedly and B) get immediate feedback on.
So if I eat whatever, a bad piece of meat, it’s immediately gross. I immediately get sick. I like, “Okay, I’m never going to do that again.”
The market doesn’t work that way.
First of all, how many truly catastrophic markets do you get in a lifetime? Two or three, probably? So someone trying to time a big decline in the market, that doesn’t come around every day. You don’t have this experience every day, and then the feedback’s not immediate.
Jessica talked about Facebook stock today. If we were to buy Facebook stock today, when would we know if that was a good decision or not? I don’t know, 10 years from now, 15 years from now, 10 minutes from now?
Don’t guess – watch for probabilities to increase, and until then, keep your portfolio as is.
We all understand a sell-off is hard. Want to vent? Shoot me an email – I’ll respond. You probably know what I’ll say, but still, I’ll respond.
Keep looking forward.

