Explore Our
“Off The Wall” Blog

Unique, straight-forward, unfiltered opinion on topics of concern for individuals with newfound wealth.

The Need for Speed… Navigating the Market Like an F1 Race

F1-market

Top speeds of ~223mph, acceleration of 0-62mph in 2.4 seconds, and the ability to navigate corners at 186mph.¹  If you want speed, Formula 1 racing is one of the fastest competitions on earth. 

Formula 1 (F1) racing has grown in popularity thanks in part to one of Netflix’s top shows “Formula 1: Drive to Survive”.  A driver’s success depends on managing their on-track emotions, and intense preparation since each course is different. Below are outlines of some tracks…they would make a fascinating inkblot test.  Right away, I see three crabs and two wizard hats.  Not sure what that means, but I do have an affinity for seafood and Harry Potter. Back to F1. 


F1-Tracks-Market

Source: How Long is an F1 Race? by Louis Pretorius 


Imagine starting a race, but not knowing which track you are on. You must rely on your past experiences and focus on what’s ahead.  Welcome to the world of investing, and lately it feels like we are in the middle of a high-speed F1 race.   

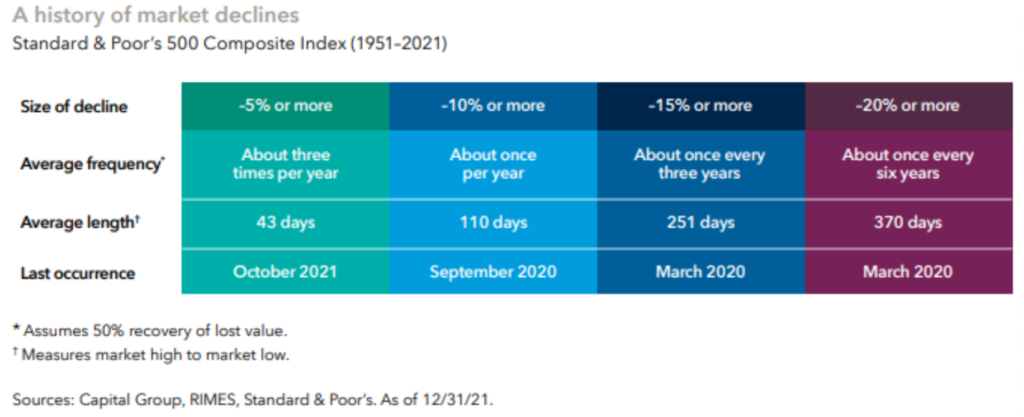
Historically a -20% decline in the S&P 500 happens about once every six years and takes 370 days on average².  It only took us about 160 days to reach the -20% mark (traditionally called a bear market) from the all-time highs set on January 4th.  This is now the third bear market decline for the index over the past four years. That’s historic. 


History-Market-Declines


However, the current decline, while insanely quick, doesn’t come close to cracking the top five worst market selloffs since 1929².  Given the negativity within the technology sector, market pundits are comparing the current selloff to the Dot-com bubble, which experienced around a -49% decline over the course of 2 ½ years (from 3/24/2000 to 10/9/2002)².   

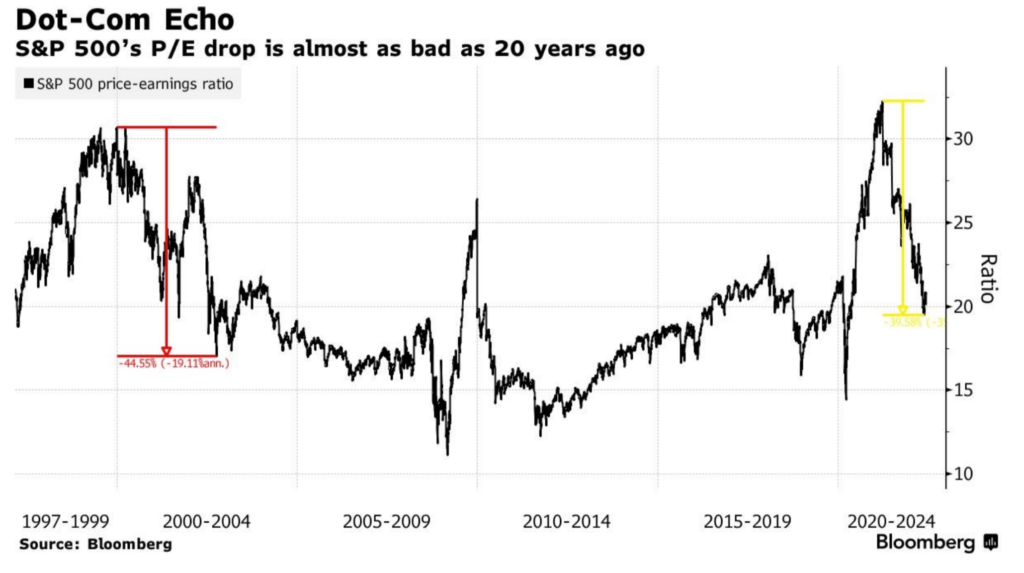
That prolonged decline has been attributed to the revaluing of technology stocks that had unstainable, sky-high Price to Earnings (P/E) ratios. Quick jargon breakdown: P/E ratios are used to quantify the price investors are paying for $1 of a company’s earnings and are frequently used to evaluate the relative “value” of a company’s stock. Higher P/Es mean you are paying more for a company’s earnings.   

P/E calculations for stocks can be affected by interest rates as investors compare the returns from a relatively safe investment (i.e., Treasury bonds) to the returns of risk assets (i.e., stocks).  As interest rates rise, bonds can become more attractive, and the price investors are willing to pay for equities decreases. So, what happens in a year like 2022, where interest rates are increasing at a rapid pace? 


Dot-Com Echo


Exactly what you’d expect, but at a blinding speed. Just like in the Dot-com declines, stocks are being revalued from a P/E standpoint, which is pushing their prices lower. The percentage drops in P/E illustrated above are a bit hard to read, but show the declines in P/E are essentially the same (40%-45%) for the Dot-com pullback and the current market selloff³.  But this time it has happened almost three times as quickly. All market selloffs can feel painful, and right now that pain may be amplified given the speed and the unknown future (or racetrack) ahead of you.   


How Should You Navigate This Track? 

Don’t panic. You don’t have to go through market selloffs alone, especially when they are moving at breakneck speeds. Investing, like F1 racing, is a team sport.   

From the pit crews to the race engineer, each person on the team needs to communicate their expertise to the driver who relies on their advice to win. There also needs to be ample preparation that goes along with the real-time communication to help the drivers consistently navigate the track. This is where experts and advisors can add significant value. 

You need to have a long-term wealth plan and accompanying portfolio in place before the race starts. Both need to be ready for “a” recession, which is always coming, and not “the” recession.  Make sure you have set aside enough cash reserves (12-18 months) to make it through market selloffs without having the need to sell your investments when the market is down. Essentially, you need enough gas to get through the race.   

Once the race begins, having constant contact with your advisor and their team helps you manage the discomfort of not knowing what turns or track lies ahead.  Trust your team to be the experts they’re trained to be and guide you along the way.  As the driver, it is your job to remain calm, keep your eyes on the road, and allow them to help you navigate the turns effectively at those fast speeds.  Take it one lap at a time and focus solely on what’s in front of you.   


Sources/Footnotes: 

  1. How Fast are F1 Cars? by Louis Pretorius; https://onestopracing.com/how-fast-are-f1-cars/#:~:text=Formula%201%20cars%20are%20able,this%20track%2C%20which%20is%20incredible. 
  2. Keys to Prevailing through stock market declines by Capital Group/American Funds; https://www.capitalgroup.com/individual/pdf/shareholder/mfgebr-051_recovrbr.pdf. 
  3. Everything in the Stock Market is Being Sped Up Including the Crash by Lu Wang of Bloomberg; https://www.bloomberg.com/news/articles/2022-06-10/everything-in-stock-market-is-being-sped-up-including-the-crash?cmpid=BBD061022_CUS&utm_medium=email&utm_source=newsletter&utm_term=220610&utm_campaign=closeamericas&sref=kOboPhAg  
Nate W. photo

Nate W. Tonsager, CIPM

Private Wealth Advisor

What comes to mind when you think of Wisconsin? Farmland? Cheese? Growing up in a small Wisconsin town, Nate can confirm that the cheese is as good as they say it is, but what shaped him most was being a part of a strong, close-knit community with a desire to help your neighbors. Nate got his first taste of the financial industry during high school...

Learn more ...

Stay up to date!

Subscribe to our “Off the Wall” Blog for articles and videos on all things wealth management, by all members of our Team. Unlike Facebook, we will never share your data with anyone.

IMPORTANT DISCLOSURE INFORMATION

Please remember that past performance is no guarantee of future results.  Different types of investments involve varying degrees of risk, and there can be no assurance that the future performance of any specific investment, investment strategy, or product (including the investments and/or investment strategies recommended or undertaken by Monument Capital Management, LLC [“Monument”]), or any non-investment related content, made reference to directly or indirectly in this blog will be profitable, equal any corresponding indicated historical performance level(s), be suitable for your portfolio or individual situation, or prove successful.  Due to various factors, including changing market conditions and/or applicable laws, the content may no longer be reflective of current opinions or positions.  Moreover, you should not assume that any discussion or information contained in this blog serves as the receipt of, or as a substitute for, personalized investment advice from Monument. To the extent that a reader has any questions regarding the applicability of any specific issue discussed above to his/her individual situation, he/she is encouraged to consult with the professional advisor of his/her choosing. No amount of prior experience or success should be construed that a certain level of results or satisfaction will be achieved if Monument is engaged, or continues to be engaged, to provide investment advisory services. Monument is neither a law firm nor a certified public accounting firm and no portion of the blog content should be construed as legal or accounting advice.

A copy of the Monument’s current written disclosure Brochure discussing our advisory services and fees is available for review upon request or at www.monumentwealthmanagement.com/disclosures. Please Note: Monument does not make any representations or warranties as to the accuracy, timeliness, suitability, completeness, or relevance of any information prepared by any unaffiliated third party, whether linked to Monument’s website or blog or incorporated herein, and takes no responsibility for any such content. All such information is provided solely for convenience purposes only and all users thereof should be guided accordingly.

Historical performance results for investment indices, benchmarks, and/or categories have been provided for general informational/comparison purposes only, and generally do not reflect the deduction of transaction and/or custodial charges, the deduction of an investment management fee, nor the impact of taxes, the incurrence of which would have the effect of decreasing historical performance results.  It should not be assumed that your Monument account holdings correspond directly to any comparative indices or categories. Please Also Note: (1) performance results do not reflect the impact of taxes; (2) comparative benchmarks/indices may be more or less volatile than your Monument accounts; and, (3) a description of each comparative benchmark/index is available upon request.

Please Remember: If you are a Monument client, please contact Monument, in writing, if there are any changes in your personal/financial situation or investment objectives for the purpose of reviewing/evaluating/revising our previous recommendations and/or services, or if you would like to impose, add, or to modify any reasonable restrictions to our investment advisory services.  Unless, and until, you notify us, in writing, to the contrary, we shall continue to provide services as we do currently. Please Also Remember to advise us if you have not been receiving account statements (at least quarterly) from the account custodian.