Our “Off The Wall” Blog
is now Monument #Unfiltered
Subscribe below to receive our unique, straight-forward, unfiltered wealth advice delivered straight to your inbox.
The Markets are YELLEN!!!

You never know what you don’t know. Larry Summers seemed all but a lock to become the next Fed Chairman to replace Ben Bernanke but under what seems like dwindling support among some key Democratic senators, he withdrew his name from consideration. The Dow Jones Industrial Average is up over 150 points on the news and the assumption is that the leading candidate is now Janet Yellen.
See below for more info on the market last week.

Fed Chairman
At this point, if the President chooses anyone other than Yellen it would come as a complete surprise – especially given her popularity. She is already a Vice-Chairwoman at the Fed, she is part of the team that created the current accommodative policies and frankly, she doesn’t piss people off like Summers has (or does). Plus, she will pass confirmation in the Senate since the Democrats will stick up for her against the few hard-nosed Republicans that will most likely obstruct just to obstruct.
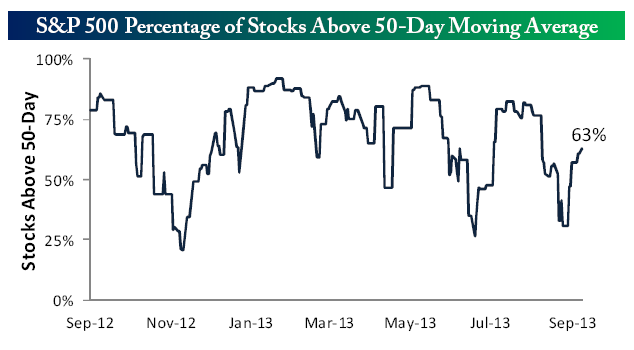
Here’s a chart from the good folks at Bespoke. Saturday morning coffee, taking the dog for a swim and reading their Weekend Report is a ritual. 63% is pretty healthy.
Stocks are rallying because economic growth is picking up (see last week’s blog on ISM reports), there is optimism that the tapering that may take place has already been priced in and will not be a huge amount (we will know more on September 18th), and the recent massive swell in interest rates has the worst behind it.
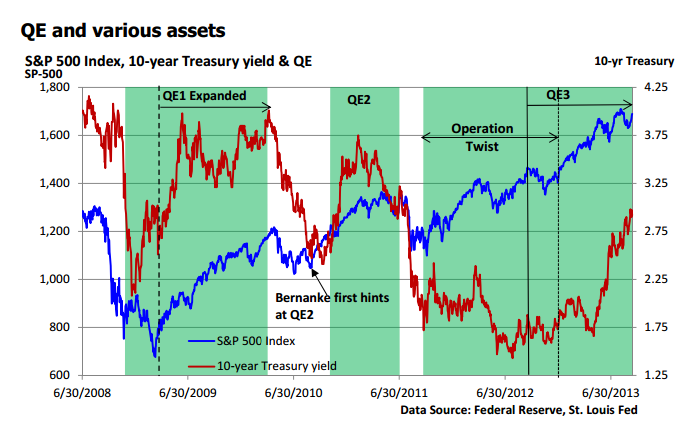
Here’s a helpful chart from Charles Sherry showing the Standard & Poor’s 500 index (S&P 500) in blue and the yield on the 10-year Treasury bill in red, cross-referenced with the different QE’s that have taken place. The huge spike in 10-year yields are obvious in red.
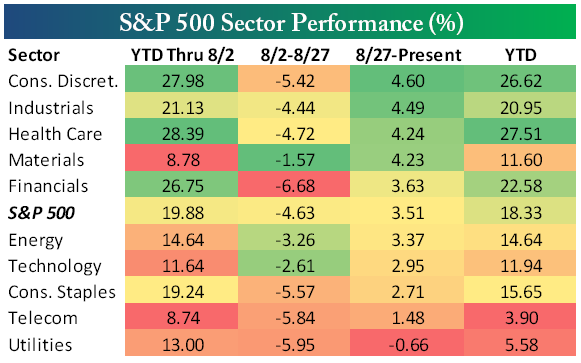
Again from Bespoke is a graphic below on Sector Performance. Cyclical sectors took a hit in August but remain leaders YTD and have rebounded nicely from the end of August slump. Of particular note are the Consumer Discretionary, (an MWM Favorite in our ETF Core Portfolio), the Industrial and Health Care sectors. Technology is the real unfortunate cyclical sector for the year. Much of this has to do with the very heavy weighting Apple Computer holds in the indices. Investors and portfolio managers holding this sector in an equal weighted format are much happier than the holders of Market Cap Weighted indices.
Speaking of indices, the Dow Jones Industrial Average (DJIA) will be replacing Alcoa, Bank of America and Hewlett-Packard with Goldman Sachs, Visa and Nike on the 23rd of this month. Given that the DJIA is calculated using the prices of the 30 underlying stocks, Goldman and Visa (with prices hovering around the $160 and $180 mark) will impact the index since they will have the 2nd and 3rd highest prices after IBM. This makes the DJIA much more indicative of the financial sector than before.
Please call or email with questions.
Investment advice offered through Monument Advisory Group, LLC a Registered Investment Advisor (RIA). Securities offered through LPL Financial. Member FINRA/SIPC. Monument Advisory Group and Monument Wealth Management are separate entities from LPL Financial.
The opinions voiced in this material are for general information only and are not intended to provide specific advice or recommendations for any individual. To determine which investment(s) may be appropriate for you, consult your financial advisor prior to investing. All performance referenced is historical and is no guarantee of future results. All indices are unmanaged and cannot be invested into directly. Stock investing involves risk including loss of principal. The Dow Jones Industrial Average is comprised of 30 stocks that are major factors in their industries, and widely held by individuals and institutional investors. The Standard & Poor’s 500 Stock Index (S&P 500) is an unmanaged capitalization weighted index of 500 stocks designed to measure performance of the broad domestic economy through changes in the aggregate market value of 500 stocks representing all major industries. The NASDAQ Composite Index measures all domestic and non-U.S. based common stocks listed on The NASDAQ Stock Market. The market value, the last sale price multiplied by total shares outstanding, is calculated throughout the trading day, and is related to the total value of the Index. The Russell 2000 Small Stock Index is an unmanaged index generally representative of the 2000 smallest companies in the Russell 3000 Index. The Russell 2000 is an unmanaged index generally comprised of companies with lower price-to-book ratios and lower forecasted growth values. The 2, 10 and 30 year Treasury is simply the yield at the close of the day.
(1) West Texas Intermediate crude spot price is as of end of week.
(2) London Bullion Market Association; gold fixing pricing at 3 p.m. London time.

David B. Armstrong, CFA
President & Co-Founder
Dave got into the industry when he discovered his passion for finance in his mid-20’s. He’s a combat veteran and served as an officer in the United States Marines Corps on both active duty and in the reserves, retiring at the rank of Lieutenant Colonel. While serving on active duty, Dave was unable to spend money on deployments, so he became a self-taught investor. Along with a few bucks cash as a bouncer, his investing performance grew to be good....
IMPORTANT DISCLOSURE INFORMATION
Please remember that past performance is no guarantee of future results. Different types of investments involve varying degrees of risk, and there can be no assurance that the future performance of any specific investment, investment strategy, or product (including the investments and/or investment strategies recommended or undertaken by Monument Capital Management, LLC [“Monument”]), or any non-investment related content, made reference to directly or indirectly in this blog will be profitable, equal any corresponding indicated historical performance level(s), be suitable for your portfolio or individual situation, or prove successful. Due to various factors, including changing market conditions and/or applicable laws, the content may no longer be reflective of current opinions or positions. Moreover, you should not assume that any discussion or information contained in this blog serves as the receipt of, or as a substitute for, personalized investment advice from Monument. To the extent that a reader has any questions regarding the applicability of any specific issue discussed above to his/her individual situation, he/she is encouraged to consult with the professional advisor of his/her choosing. No amount of prior experience or success should be construed that a certain level of results or satisfaction will be achieved if Monument is engaged, or continues to be engaged, to provide investment advisory services. Monument is neither a law firm nor a certified public accounting firm and no portion of the blog content should be construed as legal or accounting advice.
A copy of Monument’s current written disclosure Brochure discussing our advisory services and fees is available for review upon request or at www.monumentwealthmanagement.com/disclosures. Please Note: Monument does not make any representations or warranties as to the accuracy, timeliness, suitability, completeness, or relevance of any information prepared by any unaffiliated third party, whether linked to Monument’s website or blog or incorporated herein, and takes no responsibility for any such content. All such information is provided solely for convenience purposes only and all users thereof should be guided accordingly.
Historical performance results for investment indices, benchmarks, and/or categories have been provided for general informational/comparison purposes only, and generally do not reflect the deduction of transaction and/or custodial charges, the deduction of an investment management fee, nor the impact of taxes, the incurrence of which would have the effect of decreasing historical performance results. It should not be assumed that your Monument account holdings correspond directly to any comparative indices or categories. Please Also Note: (1) performance results do not reflect the impact of taxes; (2) comparative benchmarks/indices may be more or less volatile than your Monument accounts; and, (3) a description of each comparative benchmark/index is available upon request.
Please Remember: If you are a Monument client, please contact Monument, in writing, if there are any changes in your personal/financial situation or investment objectives for the purpose of reviewing/evaluating/revising our previous recommendations and/or services, or if you would like to impose, add, or to modify any reasonable restrictions to our investment advisory services. Unless, and until, you notify us, in writing, to the contrary, we shall continue to provide services as we do currently. Please Also Remember to advise us if you have not been receiving account statements (at least quarterly) from the account custodian.