Our “Off The Wall” Blog
is now Monument #Unfiltered
Subscribe below to receive our unique, straight-forward, unfiltered wealth advice delivered straight to your inbox.
The Return of the Crossing Guards

It’s definitely back to school time here in the D.C. area. The crossing guards are back and so are the mini vans. Isn’t it fitting that as the kids trudge reluctantly back to school as we head into the worst month historically of the year for the equity market?
I’m really not going to get into the Syria thing too much. Turn on the news for real time updates on that. As for how to handle this from an investing perspective, it’s my opinion that this be treated like any of the other global crises we have been through over the past few years; there will be some short-term volatility but after it all subsides, it will not really be a big event for investors who look out longer than three weeks.
Economic News
There were a lot of reports this past week. According to Bespoke Investment Group there were 20 economic indicators released last week. 12 came in better than expected, 3 were in line and 5 came in less than expected. This is a nice ratio of positive to negative given the fact that the past month of data were showing signs that the momentum was being lost.
Of note were the two ISM reports, Jobless Claims, the Non-Farm Payroll and the reported Unemployment Rate.
The ISM Manufacturing Index was released on the 3rd of September for the month of August and came in at 55.7 vs. 54.0. Any reading above 50 means manufacturing is expanding and this reading is the highest since the summer of 2011.
On the 5th, the ISM Services (ISM Non-Manufacturing) was released for the month of August and this report exceeded expectations with a reading of 58.6 vs. 55.0 and is the highest reading since December of 2005.
Initial Jobless Claims came in lower than expected at 323,000 vs. 330,000. Since the Standard & Poor’s 500 index (S&P 500) has closely tracked the movement of this index (on an inverse chart), it is encouraging to see this report continuing to trend down. The Non-Farm Payroll report for August came in weaker than expected with 169,000 new jobs versus an expected 175,000 and July was revised down from 162,000 to 104,000. That was a disappointment. So while the economy continues to produce jobs at a tepid rate, it is producing them none the less.
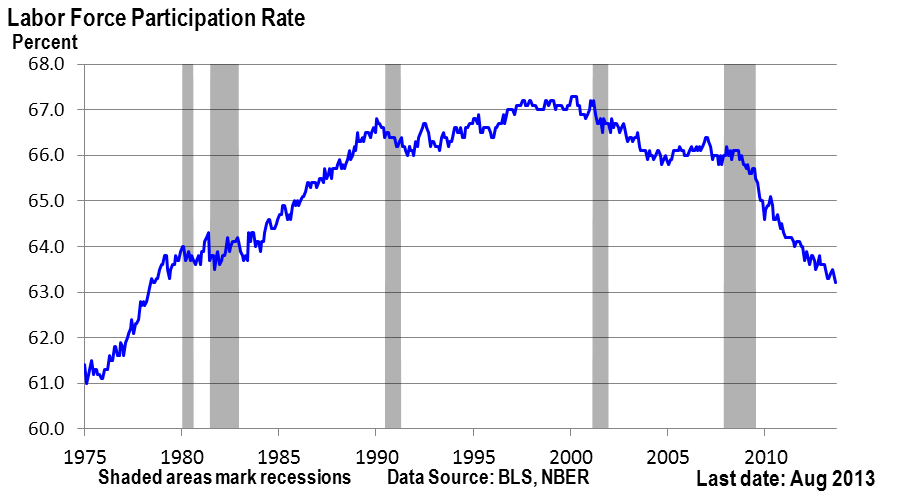
Finally the Unemployment Rate isn’t fully capturing what’s REALLY going on in the labor market right now. The rate ticked down a notch from 7.4% to 7.3% but it’s nothing to celebrate since the dope in the labor force is what was responsible for this drop. The rate is calculated by using the number of people actively seeking work in the numerator of the calculation. When the numerator of a fraction decreases it results in a smaller number. So it’s not job growth that is driving the unemployment rate down, it’s the deterioration of the labor force. See below for a graph of how much the Labor Force has declined steadily since the beginning of the 2000’s. With the average rate of 65.7% since 1980, the current reading of 63.2% is pretty bad given we are supposed to be in an economic expansion.
Finally – we love Bespoke’s research on F-150 pickup trucks. Only between 5-10% of F-150s are owned by people who just like pickup trucks. The rest are owned by people who NEED pickup trucks, like contractors, builders and business owners. August sales came in at right around 71,000 trucks which is a 22% increase over August of 2012 and is the highest reading for the month since 2006.
That’s a pretty good sign for economic growth.
Please call or email with questions.
Investment advice offered through Monument Advisory Group, LLC a Registered Investment Advisor (RIA). Securities offered through LPL Financial. Member FINRA/SIPC. Monument Advisory Group and Monument Wealth Management are separate entities from LPL Financial.
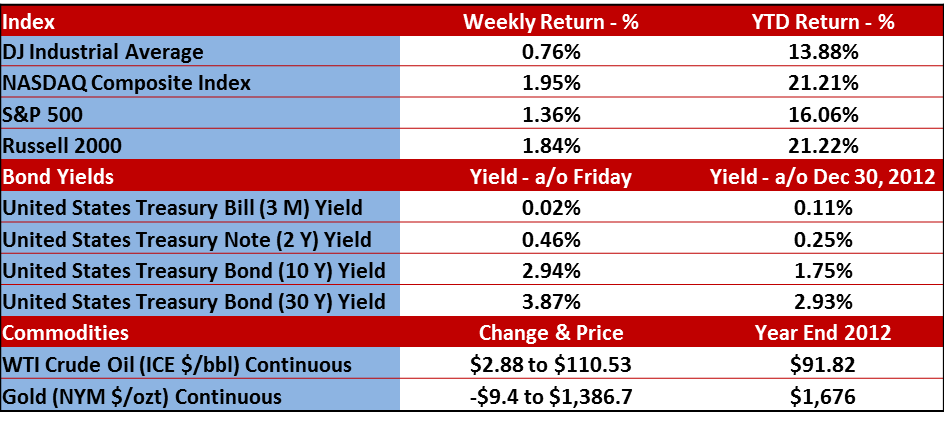
The opinions voiced in this material are for general information only and are not intended to provide specific advice or recommendations for any individual. To determine which investment(s) may be appropriate for you, consult your financial advisor prior to investing. All performance referenced is historical and is no guarantee of future results. All indices are unmanaged and cannot be invested into directly. Stock investing involves risk including loss of principal. The Dow Jones Industrial Average is comprised of 30 stocks that are major factors in their industries, and widely held by individuals and institutional investors. The Standard & Poor’s 500 Stock Index (S&P 500) is an unmanaged capitalization weighted index of 500 stocks designed to measure performance of the broad domestic economy through changes in the aggregate market value of 500 stocks representing all major industries. The NASDAQ Composite Index measures all domestic and non-U.S. based common stocks listed on The NASDAQ Stock Market. The market value, the last sale price multiplied by total shares outstanding, is calculated throughout the trading day, and is related to the total value of the Index. The Russell 2000 Small Stock Index is an unmanaged index generally representative of the 2000 smallest companies in the Russell 3000 Index. The Russell 2000 is an unmanaged index generally comprised of companies with lower price-to-book ratios and lower forecasted growth values. The 2, 10 and 30 year Treasury is simply the yield at the close of the day.
(1) West Texas Intermediate crude spot price is as of end of week.
(2) London Bullion Market Association; gold fixing pricing at 3 p.m. London time.

David B. Armstrong, CFA
President & Co-Founder
Dave got into the industry when he discovered his passion for finance in his mid-20’s. He’s a combat veteran and served as an officer in the United States Marines Corps on both active duty and in the reserves, retiring at the rank of Lieutenant Colonel. While serving on active duty, Dave was unable to spend money on deployments, so he became a self-taught investor. Along with a few bucks cash as a bouncer, his investing performance grew to be good....
IMPORTANT DISCLOSURE INFORMATION
Please remember that past performance is no guarantee of future results. Different types of investments involve varying degrees of risk, and there can be no assurance that the future performance of any specific investment, investment strategy, or product (including the investments and/or investment strategies recommended or undertaken by Monument Capital Management, LLC [“Monument”]), or any non-investment related content, made reference to directly or indirectly in this blog will be profitable, equal any corresponding indicated historical performance level(s), be suitable for your portfolio or individual situation, or prove successful. Due to various factors, including changing market conditions and/or applicable laws, the content may no longer be reflective of current opinions or positions. Moreover, you should not assume that any discussion or information contained in this blog serves as the receipt of, or as a substitute for, personalized investment advice from Monument. To the extent that a reader has any questions regarding the applicability of any specific issue discussed above to his/her individual situation, he/she is encouraged to consult with the professional advisor of his/her choosing. No amount of prior experience or success should be construed that a certain level of results or satisfaction will be achieved if Monument is engaged, or continues to be engaged, to provide investment advisory services. Monument is neither a law firm nor a certified public accounting firm and no portion of the blog content should be construed as legal or accounting advice.
A copy of Monument’s current written disclosure Brochure discussing our advisory services and fees is available for review upon request or at www.monumentwealthmanagement.com/disclosures. Please Note: Monument does not make any representations or warranties as to the accuracy, timeliness, suitability, completeness, or relevance of any information prepared by any unaffiliated third party, whether linked to Monument’s website or blog or incorporated herein, and takes no responsibility for any such content. All such information is provided solely for convenience purposes only and all users thereof should be guided accordingly.
Historical performance results for investment indices, benchmarks, and/or categories have been provided for general informational/comparison purposes only, and generally do not reflect the deduction of transaction and/or custodial charges, the deduction of an investment management fee, nor the impact of taxes, the incurrence of which would have the effect of decreasing historical performance results. It should not be assumed that your Monument account holdings correspond directly to any comparative indices or categories. Please Also Note: (1) performance results do not reflect the impact of taxes; (2) comparative benchmarks/indices may be more or less volatile than your Monument accounts; and, (3) a description of each comparative benchmark/index is available upon request.
Please Remember: If you are a Monument client, please contact Monument, in writing, if there are any changes in your personal/financial situation or investment objectives for the purpose of reviewing/evaluating/revising our previous recommendations and/or services, or if you would like to impose, add, or to modify any reasonable restrictions to our investment advisory services. Unless, and until, you notify us, in writing, to the contrary, we shall continue to provide services as we do currently. Please Also Remember to advise us if you have not been receiving account statements (at least quarterly) from the account custodian.