Fed up with the Federal Reserve? Data Can Help

I understand the Federal Reserve doesn’t have a flawless record when it comes to successfully navigating inflation cycles, however, they deserve praise this time around. The fight isn’t over yet, but as the Fed starts signaling the likely end to rate hikes, a “soft-landing” is becoming the consensus opinion.

The markets and economic data have been far apart at times this year, but it seems they might finally be coalescing. The markets increasingly look to be prioritizing hard inflation & jobs data instead of their personal feelings about the economy. Data helps remove emotion from decisions and that’s especially important when discussing inflation because in my experience inflation carries an extra emotional pain for investors.

Headline vs. Core Inflation 

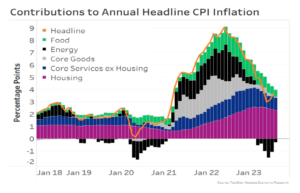
As I wrote about on LinkedIn recently, I attended an amazing conference this month hosted by one of our data providers, Nasdaq Dorsey Wright. One of the presenters shared a chart showing various categories’ contributions to year-over-year CPI inflation. The orange line shows Headline inflation, which has fallen from a peak of around 9.1% in June 2022 to around 3.7% as of August 2023.

The real value of this chart to me comes from the individual-colored bars which can be used to discern some reasons why inflation has fallen and where it might be headed next.

Some investors look at a specific combination of these factors collectively called Core Inflation, which strips out the sometimes-volatile effects of the Food (green bars) and Energy (black bars) components. That leaves Housing (where you live), Core Goods (products you buy), and Core Services (stuff you do) as the elements of Core Inflation. These groups tend to be viewed as sticky, or longer-term inflation, so let’s break each down individually.

Goods & Housing

Starting with Core Goods (the grey bars), you’ll see large gains in 2021, thanks to the aftereffects of the global pandemic shutdowns. Consumers delayed purchases leading to massive pent-up demand that flooded the markets as the world reopened and drove prices up across the board. In 2023, you see less goods inflation indicating the economy has worked through some of that excess demand and might be coming to an equilibrium point. That should help keep Goods inflation subdued going forward.

Pivoting to arguably the most important piece of Core Inflation, Housing inflation remains above its pre-pandemic levels. It’s important to remember that the official housing & rent data can lag what’s happening in the real economy. Dave discussed this in a recent blog, so check it out if you want a quick refresher.

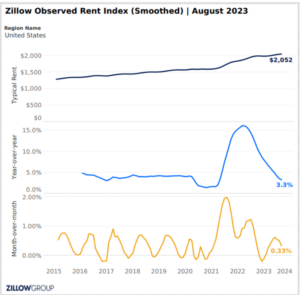
If you want a more real-time look at housing & rent prices, one alternative data source is Zillow’s Observed Rent Index. Thankfully, that has seen noticeable declines in year-over-year rent growth over the past 18 months.

If the CPI Housing data follows a similar path lower, that would also bring down both Core & Headline inflation and would move us even closer toward inflation levels that would justify the end of Fed rate hikes for good.

Services 

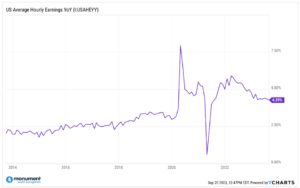
The last element of Core inflation is Core Services (stuff you do) where price increases are largely driven by worker wage growth. The pandemic effects distorted some of the wage data commonly tracked by investors, but now we are seeing some normalization. One example is US Average Hourly Earnings, which has gotten back to its pre-pandemic growth trend after some extreme COVID-induced volatility.  Volatility like this is tough on any market and taxing on investor psyches. A decline in wage growth back to “normal” is a good thing.

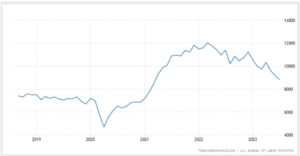
A different metric to look at if you want to gauge potential future wage growth is the number of current job openings. Why? Because workers tend to receive larger pay increases from changing jobs than they do from annual raises at their current positions. If job openings are plentiful, there’s increased potential for continued elevated wage growth in the future.

Currently, job openings remain high compared to historic levels, but do seem to be in a downward trend this year. Increasingly I hear that employers are focused on becoming more efficient with the talent they already have instead of growing their headcount. This should further help keep a lid on wage growth as companies maintain a lean approach to staffing and compensation.

Again, this move lower in the data is another sign of a healthy slowdown within a strong labor market. It’s especially great to see after we just experienced a period of rapid, abnormally high wage growth. We have cooled off a bit, but probably need to cool off more.

I don’t want negative wage growth. That would be bad for long-term economic growth, but any moderation would also hopefully flow through to Core Services inflation and bring another drop in the Headline CPI inflation rate.

This sets up a possible path for inflation to naturally go even lower from here and for the Fed to stop hiking hopefully without much more pain; the so-called “soft landing”.

Jobs 

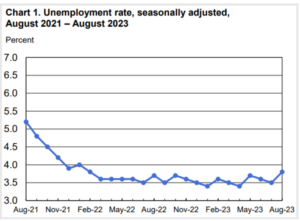
Most importantly the slowdown we’ve already seen in inflation has been happening without significantly affecting the labor market. I mean, look at this chart from the Bureau of Labor Statistics (BLS). The unemployment rate has been flat since February 2022.

Economists have long believed that to get inflation under control the Fed must drive up unemployment while sucking demand out of the system through higher rates. That hasn’t necessarily been true during this hiking cycle. We’ve seen lower inflation, interest rates stabilizing around current levels, and the job market showing minor amounts of healthy weakness.

Remain Buckled for the Fed’s Final Approach 

The “soft landing” path isn’t guaranteed and if inflation comes roaring back, anything could happen. That’s the financial policy tightrope the Fed continues to walk. It’s a death-defying act and people love to make it a spectator sport.

Earlier this year I frequently heard CNBC pundits say, “The Fed has never gotten it right before, so why do I think they are right this time?” when referring to their hiking actions. What I rarely heard from them were references to current economic data figures. Instead, they seemed to be run by their emotions and anecdotes.

What I heard repeatedly from Mr. Powell and the Fed is the phrase “data dependent”.  I applaud the way they handled a tough situation through unemotional, data-driven decision making. The Fed’s actions haven’t been predetermined and have been in response to how the economic data unfolded. It’s worked out well up to this point.

Inflation and wealth management are complex and often emotional topics. Too often investors and financial media let the narrative get in the way of the facts. Inflation feels awful, but the good news is that the data shows how effective the Fed has been so far. And there are continued signs of light at the end of the inflation tunnel.

Make sure you or your advisor are looking at the hard data to answer all your financial questions and make sure your financial plan is data dependent. In that way, it pays to be like the Fed.

Get Monument #Unfiltered: Our Free Private Wealth Newsletter

Our no B.S. wealth advice delivered 2x per month, max. Tuned specifically for busy, high-net-worth business professionals and investors who want straightforward advice without the fluff.

Nate W. photo

Nate W. Tonsager, CIPM

Private Wealth Advisor

What comes to mind when you think of Wisconsin? Farmland? Cheese? Growing up in a small Wisconsin town, Nate can confirm that the cheese is as good as they say it is, but what shaped him most was being a part of a strong, close-knit community with a desire to help your neighbors. Nate got his first taste of the financial industry during high school...

Learn more ...

IMPORTANT DISCLOSURE INFORMATION

Please remember that past performance is no guarantee of future results.  Different types of investments involve varying degrees of risk, and there can be no assurance that the future performance of any specific investment, investment strategy, or product (including the investments and/or investment strategies recommended or undertaken by Monument Capital Management, LLC [“Monument”]), or any non-investment related content, made reference to directly or indirectly in this blog will be profitable, equal any corresponding indicated historical performance level(s), be suitable for your portfolio or individual situation, or prove successful.  Due to various factors, including changing market conditions and/or applicable laws, the content may no longer be reflective of current opinions or positions.  Moreover, you should not assume that any discussion or information contained in this blog serves as the receipt of, or as a substitute for, personalized investment advice from Monument. To the extent that a reader has any questions regarding the applicability of any specific issue discussed above to his/her individual situation, he/she is encouraged to consult with the professional advisor of his/her choosing. No amount of prior experience or success should be construed that a certain level of results or satisfaction will be achieved if Monument is engaged, or continues to be engaged, to provide investment advisory services. Monument is neither a law firm nor a certified public accounting firm and no portion of the blog content should be construed as legal or accounting advice.

A copy of Monument’s current written disclosure Brochure discussing our advisory services and fees is available for review upon request or at www.monumentwealthmanagement.com/disclosures. Please Note: Monument does not make any representations or warranties as to the accuracy, timeliness, suitability, completeness, or relevance of any information prepared by any unaffiliated third party, whether linked to Monument’s website or blog or incorporated herein, and takes no responsibility for any such content. All such information is provided solely for convenience purposes only and all users thereof should be guided accordingly.

Historical performance results for investment indices, benchmarks, and/or categories have been provided for general informational/comparison purposes only, and generally do not reflect the deduction of transaction and/or custodial charges, the deduction of an investment management fee, nor the impact of taxes, the incurrence of which would have the effect of decreasing historical performance results.  It should not be assumed that your Monument account holdings correspond directly to any comparative indices or categories. Please Also Note: (1) performance results do not reflect the impact of taxes; (2) comparative benchmarks/indices may be more or less volatile than your Monument accounts; and, (3) a description of each comparative benchmark/index is available upon request.

Please Remember: If you are a Monument client, please contact Monument, in writing, if there are any changes in your personal/financial situation or investment objectives for the purpose of reviewing/evaluating/revising our previous recommendations and/or services, or if you would like to impose, add, or to modify any reasonable restrictions to our investment advisory services.  Unless, and until, you notify us, in writing, to the contrary, we shall continue to provide services as we do currently. Please Also Remember to advise us if you have not been receiving account statements (at least quarterly) from the account custodian.