I’m sure I will not be the only one using this reference to the famous scene from Spinal Tap where Nigel Tufnel explains how his band’s amplifiers go to eleven…”When you need that extra push over the cliff…”
Please, and I’m probably talking to most of the people at Monument as well as most of the Millennial Generation…please watch this 50-second clip. It will all make sense.
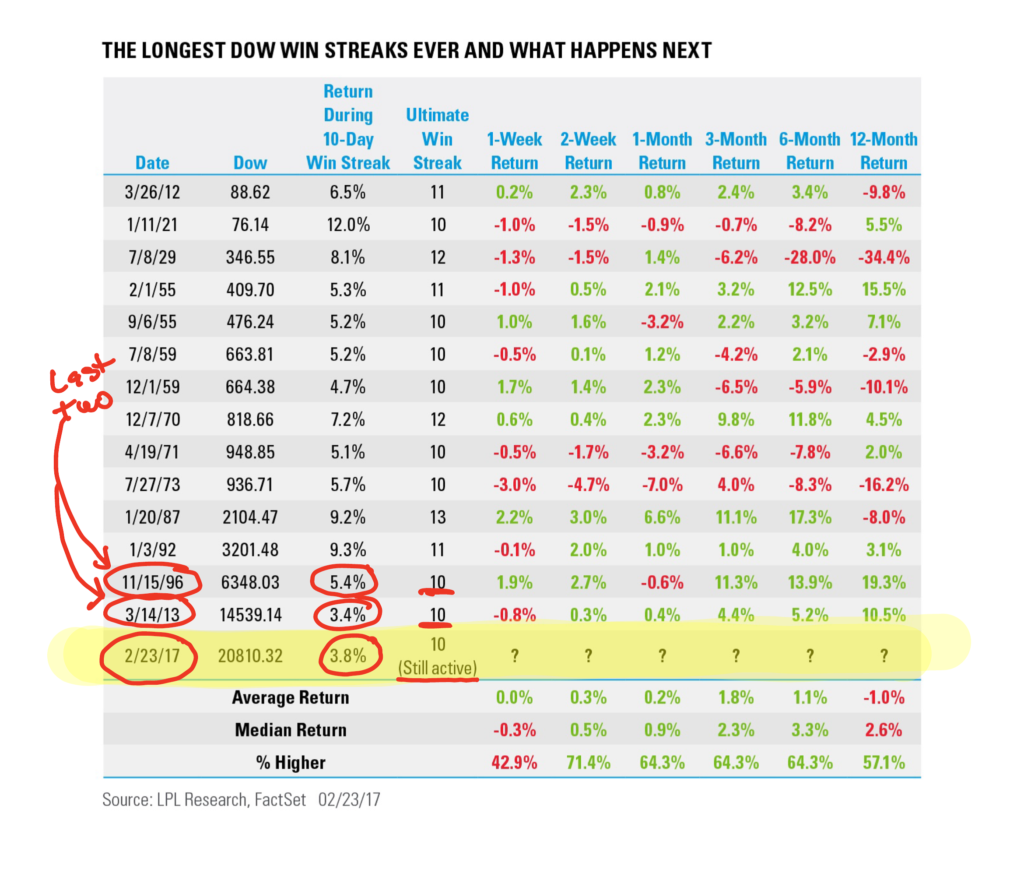
The Dow is up an incredible 10 days in a row…the longest winning streak since March of 2013. Now, the Dow is 30 stocks and not what I consider the best gauge of overall market activity, BUT everyone knows it and it garners a huge amount of attention…so I’ll comment on this.
10 days in a row is impressive, but do you know what makes this streak really remarkable? Each of the days in this rally marked a new record high.
Last time that happened?
January, 1987.
This is the fifteenth time (going back to 1900) the Dow has had a 10-day win streak.
15th…since 1900…
The past two times (November of 1996 and March of 2013), the Dow was up another 19.3% and 10.5% a year later, respectively.
However, it is worth mentioning the Dow is only up 3.8% during this current streak, making it one of the weakest returns ever during a 10-day win streak.
Per Ryan Detrick, Senior Market Strategist at LPL Financial –
“Long win streaks tend to bring with them a fear of heights, as we all know what goes up must come down. It isn’t quite that simple though when it comes to investing, as history has shown if the economy doesn’t enter a recession soon after these long win streaks, continued gains are very possible. Sure, a well-deserved pullback is possible at any time here, but to say a long win streak means a coming bear market is simply wrong and the data would support this.”
Here’s a chart also from LPL with my scribble…
I’ll wrap up my thoughts on this below but I want to cover some economic data too…
Housing and Cars – Two Things Always Worth Watching
I have written and discussed the importance of housing and cars in the economy for several years. In a nutshell, I believe that housing and cars drive so much about our economy that they must be watched.
Today, I’m going to highlight housing.
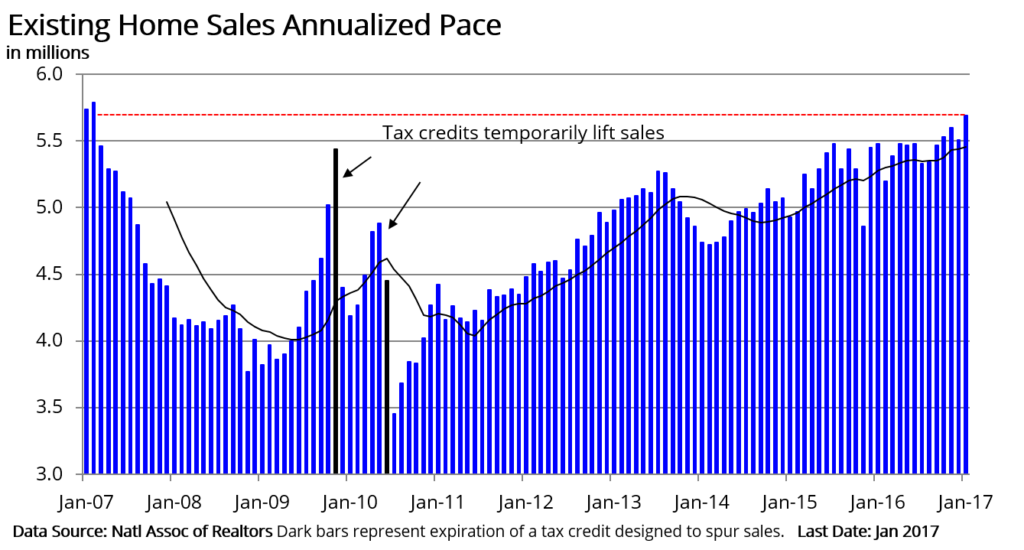
It’s amazing how far the economy and the housing sector have come since the depths of the financial crisis in 2008. The most recent housing data shows that existing home sales are at the highest level in a decade.
That’s impressive.
Worth noting is a fact that 90% of all real estate sales are existing home sales and the remaining 10% come from the sale of new homes. Here’s a chart from Charles Sherry showing existing home sales.
There have been several reasons we’ve seen a recovery in housing sales and prices, so the natural question is, “Why?”
Here are some thoughts:
- Mortgage rates remain near historically low levels. That incentivizes people to buy. The latest weekly survey from Freddie Mac (as of February 23rd, 2017) placed the 30-year fixed rate mortgage at 4.16%. People want cheap money for 30 years, and even though they are not at the very bottom, I remember my parents carrying a 13% mortgage in the 80’s. If you are a Gen X or Millennial, go ask your folks if 4.16% is a deal…because, it is.
- Then there is this uptick in consumer confidence…have you seen the Dow or the S&P 500 lately? When people feel good about their wealth, they tend to feel okay about buying a house, too.
- The economy continues to generate new jobs…so that’s also good for housing.
But that does not mean all is on easy street for housing…because challenges do remain:
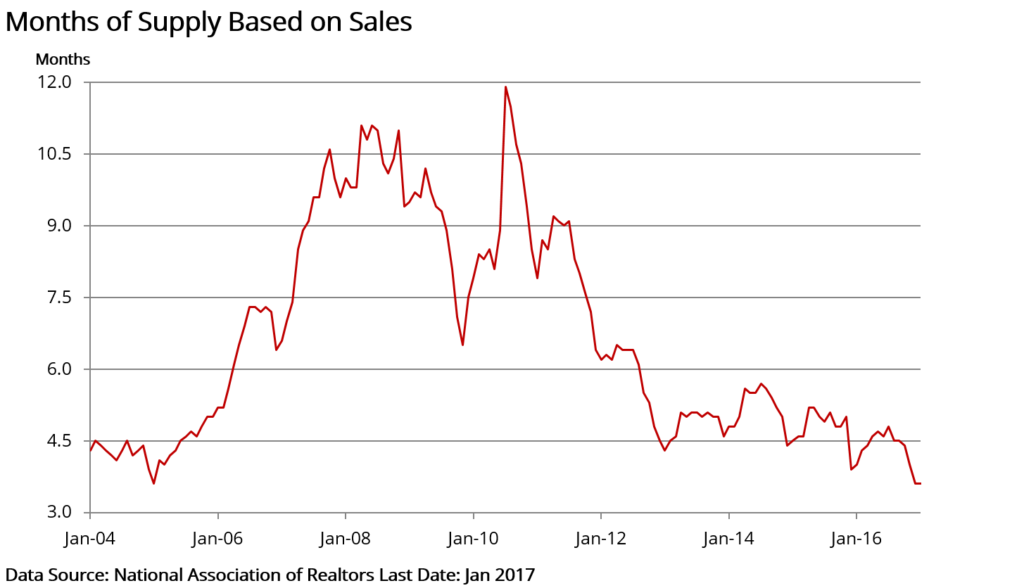
- Inventory levels (meaning the supply of houses available) are far “from adequate,” according to the National Association of Realtors. This is the same thing as saying. “Demand is higher than supply.”
- This chart below (also from Charles Sherry) highlights the low level of inventories. A level of about six months would suggest the market is in balance.
A lack of supply (inventory) creates some noteworthy conditions:
- It lends support to prices as potential homebuyers (demand) can/are outstrip(ing) the supply of readily available houses to buy.
- It can impede sales because some potential buyers are reluctant to put their home on the market amid worries they may not find a place to purchase.
- It also hinders first-time buyers, as they have fewer homes to choose from or may find themselves priced out of the market.
Oh, and please keep this in mind…Just because housing is back up around the 2008 mark, does not mean that it is a signal of another crisis. New highs don’t always signal a bubble. My parent’s first home cost $22,500 in the 60’s. Now, you could spend twice as much as that for a decent car.
Bottom line —the U.S. housing market is made up of many, many markets. Activity can vary based on location within a city, and can vary based on entry-level versus high-end luxury. That said, housing in the U.S. is in much better shape today than it was in 2008-09. In large part, it’s a reflection of a more confident consumer and an economy that is moving ahead.
When housing is strong, other good things generally follow.
Earnings
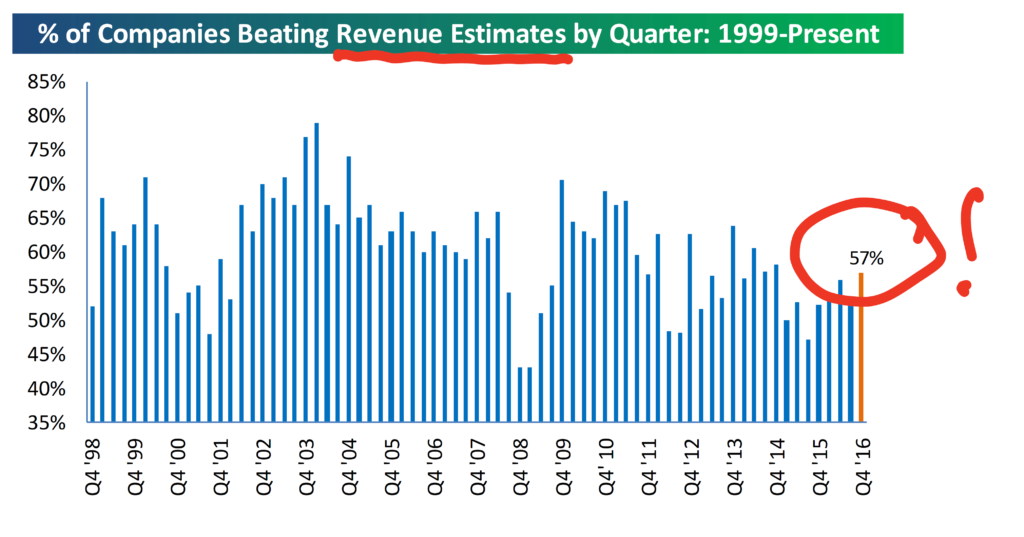
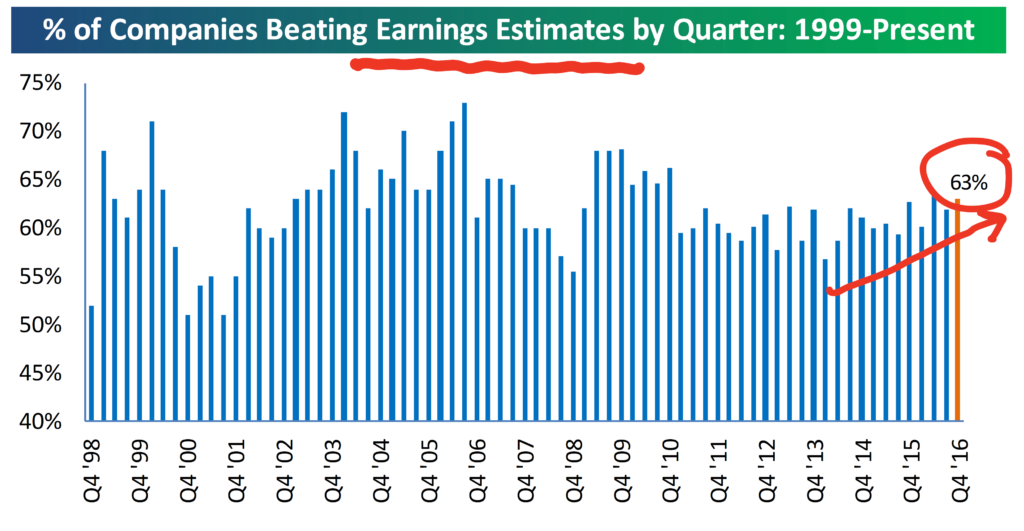
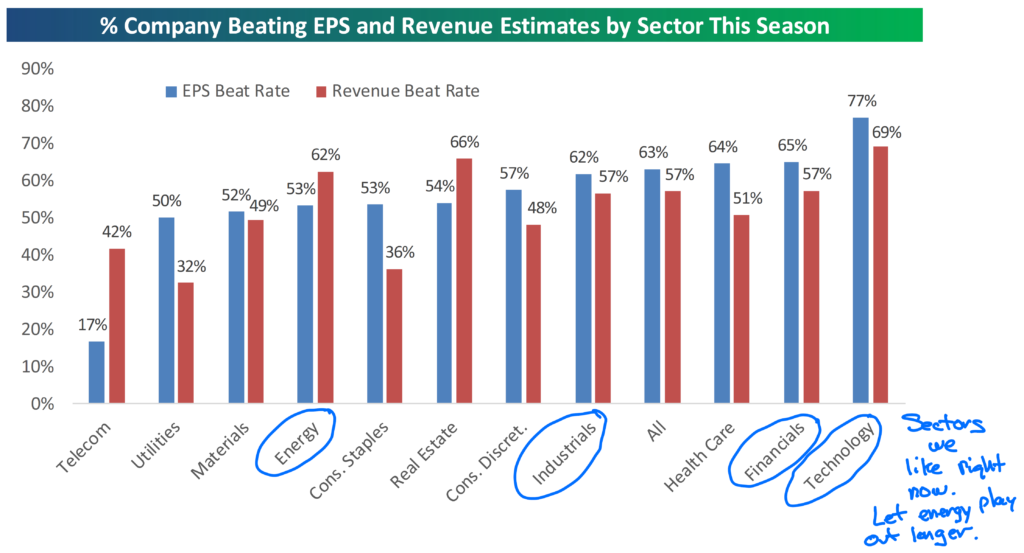
The official earnings season is over. I wrote an overview of how the schedule of earnings season works earlier this month. Revenue beats came in at 57%. That looks bad against the backdrop of the beat rates in the mid-2000’s, but 57% is a 2-year high. The charts below are all from Bespoke.
The earnings beat rate came in at 63%. There is a nice upward trend here and 63% is at the high end of the range over the past 6 or so years. I think that’s good.
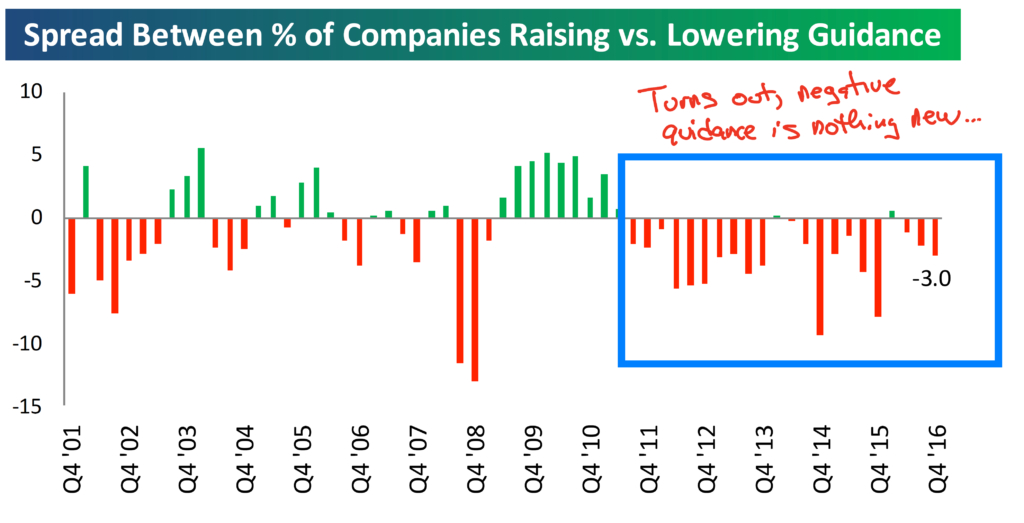
I’ve said before that sometimes interesting data and statistics don’t necessarily equate to a need to take action. The below is an example. The reality is that no company is (or has been) very excited about communicating about how good the future may look in the face of unknown regulations or tax situations.
I suspect this changes as talk turns into policy.
Here’s a final chart showing the revenue and earnings beat by sector.
Back to the Streak, and What it all Means
Look, this streak and the recent market climb will end. So will this economic recovery/expansion. We will have a downturn and we will have a recession. I just don’t know when.
Neither does anyone else.
So rather than repeat myself on this topic, I will turn to a blog written back in 2012 by Josh Brown. He is a colleague in the profession whom I have never met and I suppose he is also a competitor, although I do not see many people in my industry through that lens. He just lays it out well. I changed the f-bomb so my mom would not get mad at me although I debated for several minutes on the change.
Here’s what he wrote:
“Tops are a process, Bottoms are an event and Middles are a motherf*cker.
Because when you’re not at a top or at a bottom, but somewhere in the middle, you spend the bulk of your time worrying about which one of those two you’re closer to.
Market-timers don’t live long, it’s a horrible existence. My friend JC likes to say picking tops and bottoms is the most expensive job on Wall Street.
A lot of the media’s time and attention is spent discussing whether or not something is bottoming (housing, stocks, consumer confidence, ratings, etc.) or topping (tech stocks, valuations, bond prices, sentiment). It’s great conversation but not helpful.
Because most of the time things are not bottoming or topping. They are middle-ing. They are churning or they are trending. Most of the time, there is no inflection point at hand – these are rare occurrences. So to focus on them to such a great degree is probably a distraction and definitely a waste of time. And energy and emotion.
Think about the middle.”
He is way more deft at making this point than I am. But I’ll add this…if you are living out of cash generated by your portfolio, I believe that you should have 12-18 months of that cash already raised in your account and ready to be disbursed. If you are under that amount, fill the account back up now. That way when the market pulls back, you are not forced to raise cash then.
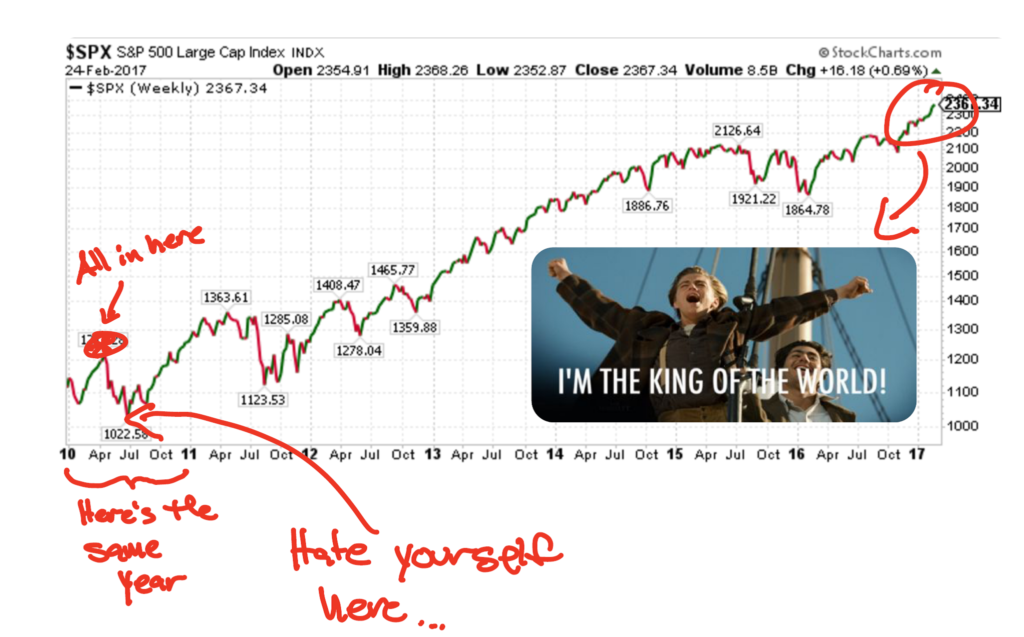
I agree with him. I don’t think it’s worth wasting your time today trying to figure out where we are in top/bottom/middle. Here are my thoughts in pictures…
Imagine it’s 2010 and you are expending a ton of emotional energy trying to figure out top/bottom/middle…and you go all in on investing around the end of April…
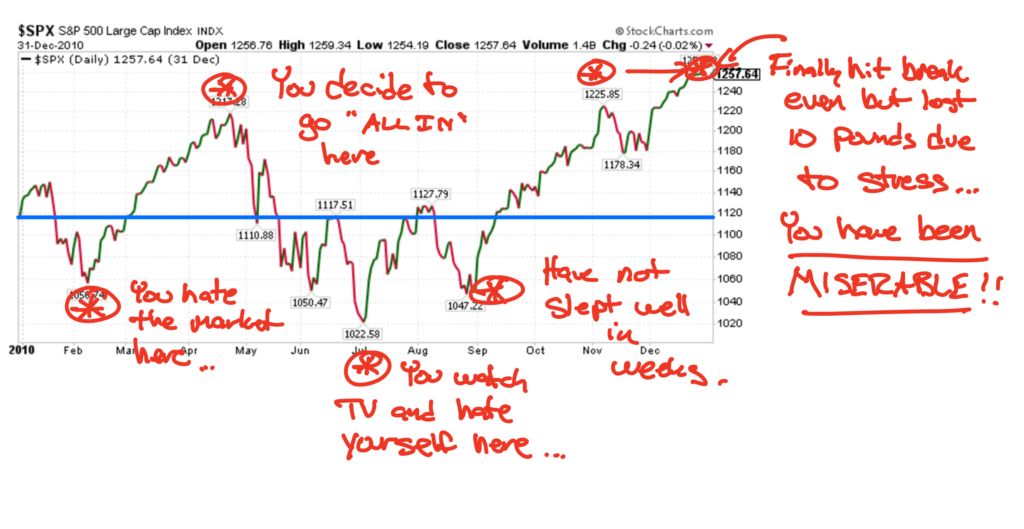
Then you see what a waste of time it was and realize that you should have just been “thinking about the middle”.
Any questions? Please reach out to us.
Important Disclosure Information
Please remember that past performance may not be indicative of future results. Different types of investments involve varying degrees of risk, and there can be no assurance that the future performance of any specific investment, investment strategy, or product (including the investments and/or investment strategies recommended or undertaken by Monument Wealth Management), or any non-investment related content, made reference to directly or indirectly in this blog will be profitable, equal any corresponding indicated historical performance level(s), be suitable for your portfolio or individual situation, or prove successful. All indexes referenced are unmanaged and cannot be invested into directly. The economic forecasts set forth may not develop as predicted. Due to various factors, including changing market conditions and/or applicable laws, the content may no longer be reflective of current opinions or positions. Moreover, you should not assume that any discussion or information contained in this blog serves as the receipt of, or as a substitute for, personalized investment advice from Monument Wealth Management. To the extent that a reader has any questions regarding the applicability of any specific issue discussed above to his/her individual situation, he/she is encouraged to consult with the professional advisor of his/her choosing. Monument Wealth Management is neither a law firm nor a certified public accounting firm and no portion of the blog content should be construed as legal or accounting advice. A copy of Monument Wealth Management’s current written disclosure statement discussing our advisory services and fees is available for review upon request.


