Vacation

I decided to take some time off last week and that included a vacation from writing the blog. Of course, while I was on vacation and not blogging, there was an article written about me and this “Off The Wall” Blog that appeared in today’s print and online edition of Investor’s Business Daily. I’ve added the link inside along with some thoughts on the market and economic data that has been released over the past week. Come on in!
I feel a lot of pressure to write a good blog after this came out.
Oh, so the Dow Jones Industrial Average closed at an all-time high last week. Just in case you have been ignoring the markets…and who would blame you…I mean most DVR’s are chocked full of Mad Men and Game of Thrones.
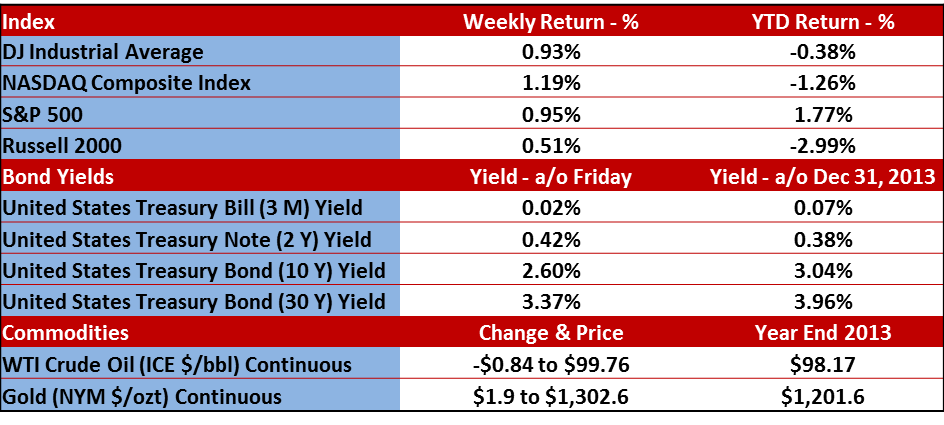
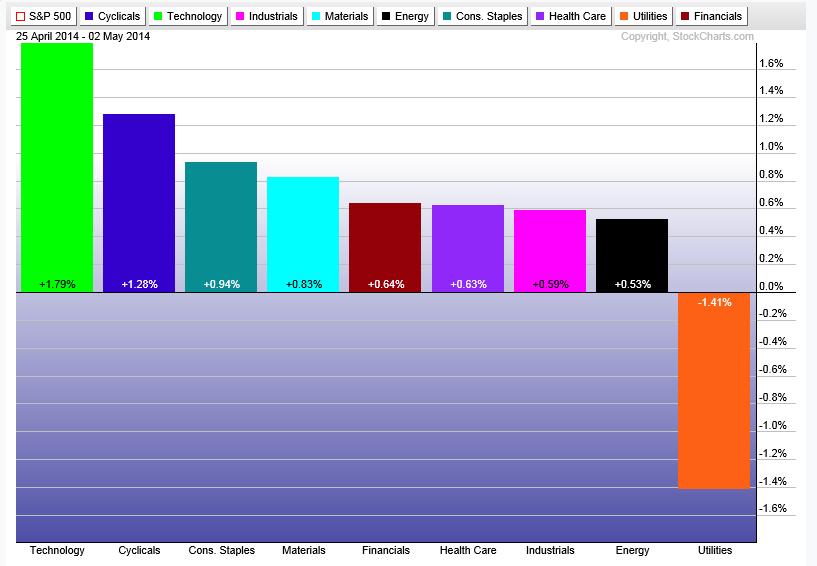
First, let’s review our standard charts below to bring you up to speed on how we fared over the trading week.
Economic Data
The first quarter Gross Domestic Product (GDP) was released. This is the broadest measure of the economy and it slowed from 2.6% annualized pace in the fourth quarter of 2013 to 0.1% in the fourth quarter of 2014. This was well shy of the estimated 1.1% estimate. Looks like winter took a bite out of economic activity, but it’s important to remember that this report looks at the economy from January through March…and we are now in May. Since this is the first report for the first quarter, I suspect it will be adjusted higher when they publish a revision (which they will do a few times).
Both ISM Manufacturing and Non-Manufacturing (Services) reports have been released.
ISM Manufacturing came in at 54.9 vs the 54.3 that was expected, so that was a little bit better than analysts thought it would be. It was the best reading of the year though, so that’s a good sign.
ISM Non-Manufacturing was reported today and came in at 55.2 vs. the 54.1 that was expected. That was an increase from the April reading of 53.1. Remember, when these reports have a reading of greater than 50, it signals expansion. So obviously readings above 50 and those that are reporting higher than the previous month are good signs. In fact, the monthly ISM Non-Manufacturing report was the 52nd straight month that this reading was above 50.
Employment
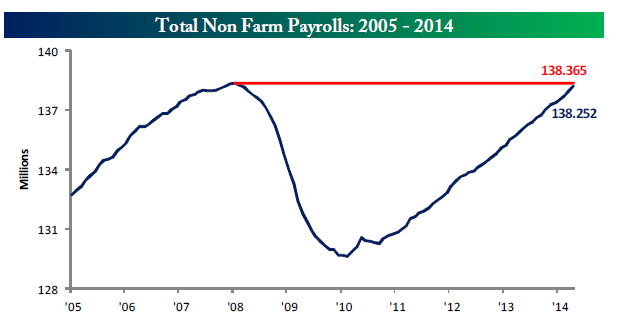
288,000 new jobs were created in April, when the expectation was for only 218,000. What’s good about that is we are a mere 113,000 new jobs away from the all-time high set in early 2008. See the below chart below from Bespoke.
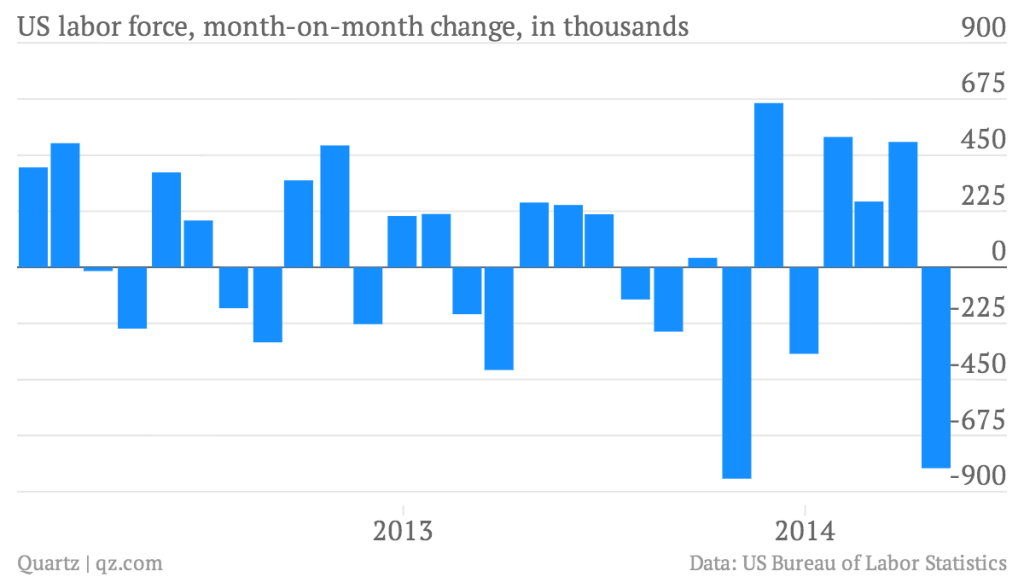
In addition, the unemployment rate moved from 6.7% down to 6.3%, but a lot of this drop is explained by the big drop in overall labor. In the chart below, note the massive blue line to the downside on the very right. It’s due to a mixture of out of work Americans giving up on the job search and baby boomers retiring. I know it seems dumb, but according to the official definition of unemployment, if you are not working and choose to put your job search on hold, you are not counted in the official unemployment rate. The unofficial definition is “too pissed to even look for a job anymore.” You can look that up on the internet.
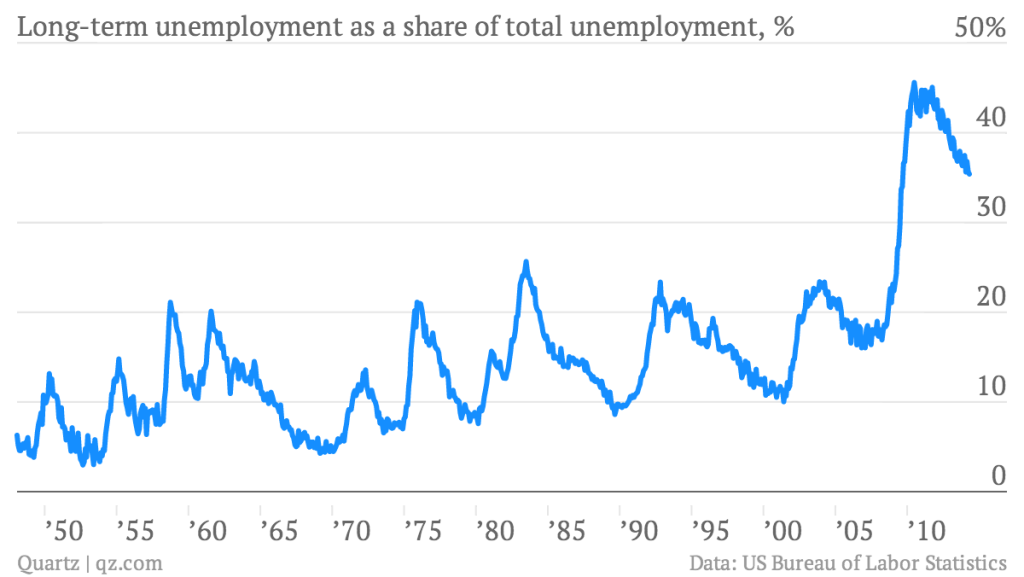
Then there is this graph, below. This shows that while the number is getting better, there are still A LOT of people who are considered long-term unemployed as a percentage of total unemployment. This is not that great because while the headline unemployment is what a lot of people (politicians) like to look at, we still have a lot of people who can’t find a job. And with the way technology changes in the work place, a year out of work can have a devastating effect on a person’s ability to find a new job. So there are still some serious systemic problems in the overall labor market.
Earnings
We follow Bespoke Investment Group for earnings research. According to them, over 1,500 companies have reported their earnings and revenue for the first quarter of 2014 and we are closing in on the end of the reporting season (mid-May). Here’s where we stand:
- The percentage of companies beating their revenue estimates for the first quarter of 2014 currently sits at 56.4%. This number is well below the average of 60% we’ve seen since 2001 and nowhere NEAR the 63.8% that finished up the fourth quarter of 2013. Of course, the earnings reports are not all through yet, but that sure would be a big move from 56.4% up to 63.8%.
- The percentage of companies beating their earnings estimates stands at 60%, which is a tad off the 61.9% final reading from the fourth quarter.
They also publish a chart that shows the spread between companies guiding future earnings higher or lower on a percentage basis. Up to this quarter, the spread has been negative for the TEN previous quarters, meaning that there are more companies stating they will earn less in the upcoming quarter than the same quarter a year prior.
As of Friday, the spread between companies posting negative guidance vs. companies posting positive guidance stands at +0.1%. That means, depending on this week, it is possible we could see this reading turn positive for the first quarter out of the last eleven quarters.
Otherwise, it could be eleven straight times in a row.
 Important Disclosure Information
Please remember that past performance may not be indicative of future results. Different types of investments involve varying degrees of risk, and there can be no assurance that the future performance of any specific investment, investment strategy, or product (including the investments and/or investment strategies recommended or undertaken by Monument Wealth Management), or any non-investment related content, made reference to directly or indirectly in this blog will be profitable, equal any corresponding indicated historical performance level(s), be suitable for your portfolio or individual situation, or prove successful. Due to various factors, including changing market conditions and/or applicable laws, the content may no longer be reflective of current opinions or positions. Moreover, you should not assume that any discussion or information contained in this blog serves as the receipt of, or as a substitute for, personalized investment advice from Monument Wealth Management. To the extent that a reader has any questions regarding the applicability of any specific issue discussed above to his/her individual situation, he/she is encouraged to consult with the professional advisor of his/her choosing. Monument Wealth Management is neither a law firm nor a certified public accounting firm and no portion of the blog content should be construed as legal or accounting advice. A copy of Monument Wealth Management’s current written disclosure statement discussing our advisory services and fees is available for review upon request.

David B. Armstrong, CFA
President & Co-Founder
Dave got into the industry when he discovered his passion for finance in his mid-20’s. He’s a combat veteran and served as an officer in the United States Marines Corps on both active duty and in the reserves, retiring at the rank of Lieutenant Colonel. While serving on active duty, Dave was unable to spend money on deployments, so he became a self-taught investor. Along with a few bucks cash as a bouncer, his investing performance grew to be good....
IMPORTANT DISCLOSURE INFORMATION
Please remember that past performance is no guarantee of future results. Different types of investments involve varying degrees of risk, and there can be no assurance that the future performance of any specific investment, investment strategy, or product (including the investments and/or investment strategies recommended or undertaken by Monument Capital Management, LLC [“Monument”]), or any non-investment related content, made reference to directly or indirectly in this blog will be profitable, equal any corresponding indicated historical performance level(s), be suitable for your portfolio or individual situation, or prove successful. Due to various factors, including changing market conditions and/or applicable laws, the content may no longer be reflective of current opinions or positions. Moreover, you should not assume that any discussion or information contained in this blog serves as the receipt of, or as a substitute for, personalized investment advice from Monument. To the extent that a reader has any questions regarding the applicability of any specific issue discussed above to his/her individual situation, he/she is encouraged to consult with the professional advisor of his/her choosing. No amount of prior experience or success should be construed that a certain level of results or satisfaction will be achieved if Monument is engaged, or continues to be engaged, to provide investment advisory services. Monument is neither a law firm nor a certified public accounting firm and no portion of the blog content should be construed as legal or accounting advice.
A copy of Monument’s current written disclosure Brochure discussing our advisory services and fees is available for review upon request or at www.monumentwealthmanagement.com/disclosures. Please Note: Monument does not make any representations or warranties as to the accuracy, timeliness, suitability, completeness, or relevance of any information prepared by any unaffiliated third party, whether linked to Monument’s website or blog or incorporated herein, and takes no responsibility for any such content. All such information is provided solely for convenience purposes only and all users thereof should be guided accordingly.
Historical performance results for investment indices, benchmarks, and/or categories have been provided for general informational/comparison purposes only, and generally do not reflect the deduction of transaction and/or custodial charges, the deduction of an investment management fee, nor the impact of taxes, the incurrence of which would have the effect of decreasing historical performance results. It should not be assumed that your Monument account holdings correspond directly to any comparative indices or categories. Please Also Note: (1) performance results do not reflect the impact of taxes; (2) comparative benchmarks/indices may be more or less volatile than your Monument accounts; and, (3) a description of each comparative benchmark/index is available upon request.
Please Remember: If you are a Monument client, please contact Monument, in writing, if there are any changes in your personal/financial situation or investment objectives for the purpose of reviewing/evaluating/revising our previous recommendations and/or services, or if you would like to impose, add, or to modify any reasonable restrictions to our investment advisory services. Unless, and until, you notify us, in writing, to the contrary, we shall continue to provide services as we do currently. Please Also Remember to advise us if you have not been receiving account statements (at least quarterly) from the account custodian.