Our “Off The Wall” Blog
is now Monument #Unfiltered
Subscribe below to receive our unique, straight-forward, unfiltered wealth advice delivered straight to your inbox.
There is Nothing Obstructing this Market.

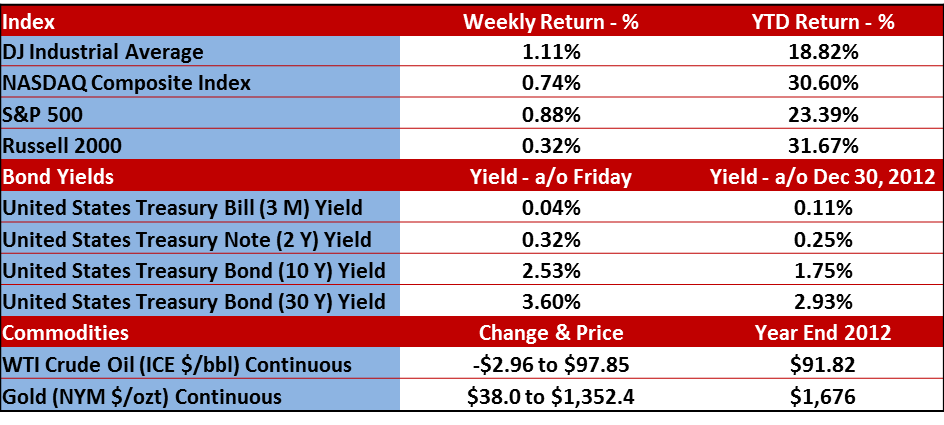
The Dow Jones Industrial Average (DJIA) and the Standard & Poor’s 500 Index (S&P 500) advanced for the third straight week, and like the prior period, the S&P 500 ended the week with a fresh record high. In the meantime, the NASDAQ Composite posted its second gain in three weeks, finishing at an index level of 3,943. This is its highest close since September of 2000 when stocks were sliding down the backside of the Internet bubble but year-to-day this index is up over 30%. THIRTY PERCENT! So, are we getting ahead of ourselves? Humm…maybe. Read on.
Market corrections are generally defined as any correction that has a 10% move off of a previous high. According to a Bespoke Investment Group (BIG) research report I read over the weekend, it has been 519 trading days since we’ve had a market correction of over 10%. That’s a long time but we actually went twice as long between 2003 and 2007. 1990 to 1997 was 1,767 days without a correction. My point here is that just because we have gone over 500 days without a correction it does not mean we are going to have one.
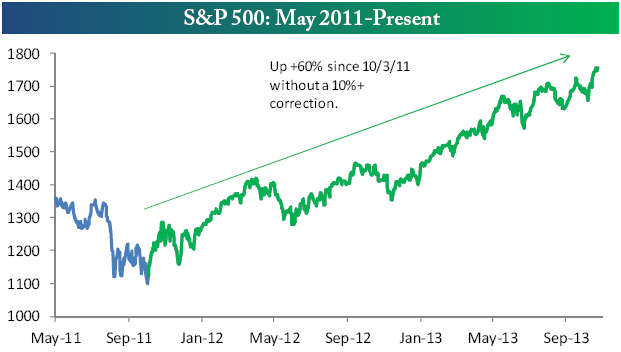
We may or may not, but regardless, the number of days we have gone without a 10% pullback has no bearing whatsoever on if we will or will not have a correction. In fact, over the last 20 years, the Dow has averaged a November gain of 1.88% with positive returns 65% of the time (thanks again BIG). I’ll predict we are going to hear a lot of financial advisors on CNBC and Fox Business News who, put there by the PR firms they pay $6,000 per month, will start to call for a correction. Don’t listen to them. They are full of BUNK if they start with any predictions.
Patience. Have it. Have it in your plan and have it in your investment strategy.
In fact, I spent a lot of the weekend reading about the Battle of Antietam. Believe me, there is a lot more to be gleaned from that battle about patience, good decision making, bad decision making, indecision and momentum than you will ever glean from some boob on CNBC.
“What the Hell is going on,” you ask?
The economy barely continues its sluggish recovery, there’s no shortage of uncertainty on Main Street, and we’ve just witnessed ANOTHER bruising battle in Washington.
My answer? The themes that drove equities higher earlier in the year have begun to reaffirm themselves. The subpar economic recovery, coupled with the recent government shutdown, has increased the odds that the Fed’s very easy monetary policy (Quantitative Easing or “QE”) will remain in place for longer than many analysts had anticipated. Remember, it was just early summer that the 10-year Treasury bill shot up 1% on the “taper tantrum.”
That expectation was cemented last week after the government reported September nonfarm payrolls rose by a less-than-forecast 148,000. The report was down from an upwardly revised 193,000 in August.
Recall that the $85 billion in monthly bond buys by the Federal Reserve are designed to boost bond prices and lower bond yields (bond prices and yields are inversely related), which in turn reduces borrowing costs for consumers and business. The goal is to encourage stronger spending, which should lead to more hiring.
Only then has the Fed said it will consider raising interest rates.
It’s EARNINGS SEASON!
So with an economy doing poorly enough to keep the easy monetary policy in place, wouldn’t that signal some weak earnings reports? Let’s take a peek…
Last week, we heard from another 539 companies (729 total so far), out of the more than 2,000 that will report quarterly earnings. It was a pretty heavy week of reporting so there are some good numbers to take a look at.
While it’s really a little too early to measure the ratio of companies posting negative guidance against the companies posting positive guidance, last quarter ended as the 8th quarter in a row of a negative spread for this ratio. We will be writing about it in upcoming blogs.
The percentage of companies beating their revenue estimate for the 3rd quarter of 2013 currently sits at 54.4% (vs. 50.9% last week), which is a nice upward move but still lower than the average of 60% since 2001. The percentage of companies beating their earnings estimates stands at 63.5% (vs. 60.5), which is higher than the final reading from the 2nd quarter. With the exception of a quarterly setback in the 1st quarter of 2013, we have seen a nice steady quarter-over-quarter increase in earnings since the 2nd quarter of 2012.
That’s nothing epic, but it doesn’t suck either.
Please call or email with questions.
Investment advice offered through Monument Advisory Group, LLC a Registered Investment Advisor (RIA). Securities offered through LPL Financial. Member FINRA/SIPC. Monument Advisory Group and Monument Wealth Management are separate entities from LPL Financial.
The opinions voiced in this material are for general information only and are not intended to provide specific advice or recommendations for any individual. To determine which investment(s) may be appropriate for you, consult your financial advisor prior to investing. All performance referenced is historical and is no guarantee of future results. All indices are unmanaged and cannot be invested into directly. Stock investing involves risk including loss of principal. The Dow Jones Industrial Average is comprised of 30 stocks that are major factors in their industries, and widely held by individuals and institutional investors. The Standard & Poor’s 500 Stock Index (S&P 500) is an unmanaged capitalization weighted index of 500 stocks designed to measure performance of the broad domestic economy through changes in the aggregate market value of 500 stocks representing all major industries. The NASDAQ Composite Index measures all domestic and non-U.S. based common stocks listed on The NASDAQ Stock Market. The market value, the last sale price multiplied by total shares outstanding, is calculated throughout the trading day, and is related to the total value of the Index. The Russell 2000 Small Stock Index is an unmanaged index generally representative of the 2000 smallest companies in the Russell 3000 Index. The Russell 2000 is an unmanaged index generally comprised of companies with lower price-to-book ratios and lower forecasted growth values. The 2, 10 and 30 year Treasury is simply the yield at the close of the day.
(1) West Texas Intermediate crude spot price is as of end of week.
(2) London Bullion Market Association; gold fixing pricing at 3 p.m. London time.

David B. Armstrong, CFA
President & Co-Founder
Dave got into the industry when he discovered his passion for finance in his mid-20’s. He’s a combat veteran and served as an officer in the United States Marines Corps on both active duty and in the reserves, retiring at the rank of Lieutenant Colonel. While serving on active duty, Dave was unable to spend money on deployments, so he became a self-taught investor. Along with a few bucks cash as a bouncer, his investing performance grew to be good....
IMPORTANT DISCLOSURE INFORMATION
Please remember that past performance is no guarantee of future results. Different types of investments involve varying degrees of risk, and there can be no assurance that the future performance of any specific investment, investment strategy, or product (including the investments and/or investment strategies recommended or undertaken by Monument Capital Management, LLC [“Monument”]), or any non-investment related content, made reference to directly or indirectly in this blog will be profitable, equal any corresponding indicated historical performance level(s), be suitable for your portfolio or individual situation, or prove successful. Due to various factors, including changing market conditions and/or applicable laws, the content may no longer be reflective of current opinions or positions. Moreover, you should not assume that any discussion or information contained in this blog serves as the receipt of, or as a substitute for, personalized investment advice from Monument. To the extent that a reader has any questions regarding the applicability of any specific issue discussed above to his/her individual situation, he/she is encouraged to consult with the professional advisor of his/her choosing. No amount of prior experience or success should be construed that a certain level of results or satisfaction will be achieved if Monument is engaged, or continues to be engaged, to provide investment advisory services. Monument is neither a law firm nor a certified public accounting firm and no portion of the blog content should be construed as legal or accounting advice.
A copy of Monument’s current written disclosure Brochure discussing our advisory services and fees is available for review upon request or at www.monumentwealthmanagement.com/disclosures. Please Note: Monument does not make any representations or warranties as to the accuracy, timeliness, suitability, completeness, or relevance of any information prepared by any unaffiliated third party, whether linked to Monument’s website or blog or incorporated herein, and takes no responsibility for any such content. All such information is provided solely for convenience purposes only and all users thereof should be guided accordingly.
Historical performance results for investment indices, benchmarks, and/or categories have been provided for general informational/comparison purposes only, and generally do not reflect the deduction of transaction and/or custodial charges, the deduction of an investment management fee, nor the impact of taxes, the incurrence of which would have the effect of decreasing historical performance results. It should not be assumed that your Monument account holdings correspond directly to any comparative indices or categories. Please Also Note: (1) performance results do not reflect the impact of taxes; (2) comparative benchmarks/indices may be more or less volatile than your Monument accounts; and, (3) a description of each comparative benchmark/index is available upon request.
Please Remember: If you are a Monument client, please contact Monument, in writing, if there are any changes in your personal/financial situation or investment objectives for the purpose of reviewing/evaluating/revising our previous recommendations and/or services, or if you would like to impose, add, or to modify any reasonable restrictions to our investment advisory services. Unless, and until, you notify us, in writing, to the contrary, we shall continue to provide services as we do currently. Please Also Remember to advise us if you have not been receiving account statements (at least quarterly) from the account custodian.