Our “Off The Wall” Blog
is now Monument #Unfiltered
Subscribe below to receive our unique, straight-forward, unfiltered wealth advice delivered straight to your inbox.
The Value of Doing Nothing

There is no shortage of advice out there on what to do next in the market – present writer included – but I was recently reminded of the famous quote, “Don’t underestimate the value of doing nothing, of just going along.” Who said it? Winnie the Pooh. Of course he also said “I am a bear of very little brain and long words bother me.”
Since we are discussing bears, they are all running for cover as the markets have hit new highs once again. On Thursday, the Standard & Poor’s 500 (S&P 500) hit a new all-time high and is now up almost 150% from the lowest posted on March 9, 2009. Viewed another way, the S&P 500 has gone 1,592 days without a correction of 20%, which is the classic definition of a bear market. The record was set between 1987 and 2000 where the index went 4,494 days without a 20% decline. Email me if you’d like the exact technical spec of what defines a bull and bear market.
Oh, and as for the value of doing nothing? The S&P 500 is up just about 6.5% from the little May through June 24 sell-off, when there was a ton of panic over the Taper Tantrum.
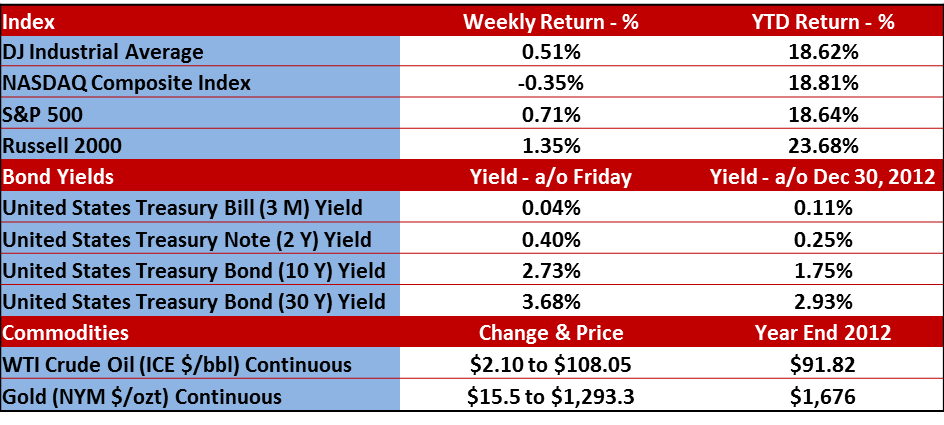
Here’s a recap of how the market did last week.
Earnings Season – I Love It.
200 companies have reported their second quarter earnings so far. While a lot of analysts will say that it’s easy to clear a bar that’s laying on the floor, earnings ARE coming in a lot better than expected so far. While it’s too early say that this quarter could log a recent record on the percentage of companies beating their excepted earnings, it currently stands at 75%, according to Bespoke Investment Group.
Bespoke Investment Group follows corporate earnings very closely. They publish a chart that shows the spread between companies guiding future earnings higher or lower on a percentage basis. Up to this quarter, the spread has been negative for the SEVEN previous quarters – meaning that there are more companies stating they will earn less in the upcoming quarter than the same quarter a year prior.
As of Friday, companies posting negative guidance was DEAD EVEN with the companies posting positive guidance. This is promising and may be a sign that companies are more positive about the future.
That leads me to providing a nugget for those of you who are wondering why the market is up so much. You see, the stock market is a leading indicator. The economy is not. The market starts doing better in anticipation of the economy getting better. The market does better when companies start to forecast that their earnings are getting better. So if we have had 7 quarters of negative spread between companies guiding higher vs. lower earnings and it’s looking like we could potentially see a reversal, I think that’s news we can all feel good about for the market and the economy over the next year.
Here’s the key to remember (and this will sound like a skipping record for those of you who have actually listened to a record before)…don’t get all euphoric OR bent out of shape about the market. Panic and exultation is for charlatans, the unprepared and selling airtime on CNBC.
In fact, the best reaction to the market comes from the well prepared investor who is following a long-term plan and should sound something like this, “The market is up/down? Hmmm, interesting. When does the college football season start?”
Please call or email with questions.
Investment advice offered through Monument Advisory Group, LLC a Registered Investment Advisor (RIA). Securities offered through LPL Financial. Member FINRA/SIPC. Monument Advisory Group and Monument Wealth Management are separate entities from LPL Financial.
The opinions voiced in this material are for general information only and are not intended to provide specific advice or recommendations for any individual. To determine which investment(s) may be appropriate for you, consult your financial advisor prior to investing. All performance referenced is historical and is no guarantee of future results. All indices are unmanaged and cannot be invested into directly. Stock investing involves risk including loss of principal. The Dow Jones Industrial Average is comprised of 30 stocks that are major factors in their industries, and widely held by individuals and institutional investors. The Standard & Poor’s 500 Stock Index (S&P 500) is an unmanaged capitalization weighted index of 500 stocks designed to measure performance of the broad domestic economy through changes in the aggregate market value of 500 stocks representing all major industries. The NASDAQ Composite Index measures all domestic and non-U.S. based common stocks listed on The NASDAQ Stock Market. The market value, the last sale price multiplied by total shares outstanding, is calculated throughout the trading day, and is related to the total value of the Index. The Russell 2000 Small Stock Index is an unmanaged index generally representative of the 2000 smallest companies in the Russell 3000 Index. The Russell 2000 is an unmanaged index generally comprised of companies with lower price-to-book ratios and lower forecasted growth values. The 2, 10 and 30 year Treasury is simply the yield at the close of the day.
(1) West Texas Intermediate crude spot price is as of end of week.
(2) London Bullion Market Association; gold fixing pricing at 3 p.m. London time.

David B. Armstrong, CFA
President & Co-Founder
Dave got into the industry when he discovered his passion for finance in his mid-20’s. He’s a combat veteran and served as an officer in the United States Marines Corps on both active duty and in the reserves, retiring at the rank of Lieutenant Colonel. While serving on active duty, Dave was unable to spend money on deployments, so he became a self-taught investor. Along with a few bucks cash as a bouncer, his investing performance grew to be good....
IMPORTANT DISCLOSURE INFORMATION
Please remember that past performance is no guarantee of future results. Different types of investments involve varying degrees of risk, and there can be no assurance that the future performance of any specific investment, investment strategy, or product (including the investments and/or investment strategies recommended or undertaken by Monument Capital Management, LLC [“Monument”]), or any non-investment related content, made reference to directly or indirectly in this blog will be profitable, equal any corresponding indicated historical performance level(s), be suitable for your portfolio or individual situation, or prove successful. Due to various factors, including changing market conditions and/or applicable laws, the content may no longer be reflective of current opinions or positions. Moreover, you should not assume that any discussion or information contained in this blog serves as the receipt of, or as a substitute for, personalized investment advice from Monument. To the extent that a reader has any questions regarding the applicability of any specific issue discussed above to his/her individual situation, he/she is encouraged to consult with the professional advisor of his/her choosing. No amount of prior experience or success should be construed that a certain level of results or satisfaction will be achieved if Monument is engaged, or continues to be engaged, to provide investment advisory services. Monument is neither a law firm nor a certified public accounting firm and no portion of the blog content should be construed as legal or accounting advice.
A copy of Monument’s current written disclosure Brochure discussing our advisory services and fees is available for review upon request or at www.monumentwealthmanagement.com/disclosures. Please Note: Monument does not make any representations or warranties as to the accuracy, timeliness, suitability, completeness, or relevance of any information prepared by any unaffiliated third party, whether linked to Monument’s website or blog or incorporated herein, and takes no responsibility for any such content. All such information is provided solely for convenience purposes only and all users thereof should be guided accordingly.
Historical performance results for investment indices, benchmarks, and/or categories have been provided for general informational/comparison purposes only, and generally do not reflect the deduction of transaction and/or custodial charges, the deduction of an investment management fee, nor the impact of taxes, the incurrence of which would have the effect of decreasing historical performance results. It should not be assumed that your Monument account holdings correspond directly to any comparative indices or categories. Please Also Note: (1) performance results do not reflect the impact of taxes; (2) comparative benchmarks/indices may be more or less volatile than your Monument accounts; and, (3) a description of each comparative benchmark/index is available upon request.
Please Remember: If you are a Monument client, please contact Monument, in writing, if there are any changes in your personal/financial situation or investment objectives for the purpose of reviewing/evaluating/revising our previous recommendations and/or services, or if you would like to impose, add, or to modify any reasonable restrictions to our investment advisory services. Unless, and until, you notify us, in writing, to the contrary, we shall continue to provide services as we do currently. Please Also Remember to advise us if you have not been receiving account statements (at least quarterly) from the account custodian.