The Looming 2013 Debt Ceiling Debate
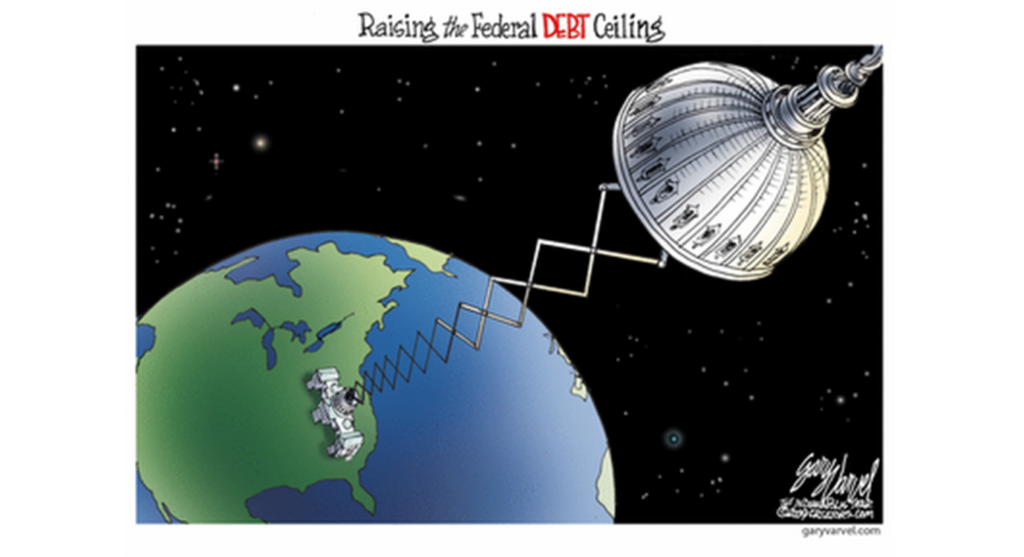
Like I said last week, I’m happy 2012 is over because I was sick and tired of watching the Fiscal Cliff count down timer on CNBC. But I suspect it will be any day now that it is replaced with a Debt Ceiling Debate count down timer.
Here’s the only countdown clock I’m watching today – the one counting down to the BCS College Football Championship. While I have great friends who are Irish fans, I have to pull for my SEC! Roll Tide.
Last week’s market return was pretty stellar. In fact, it was the best week in a long, long time – especially for small cap stocks. The Standard & Poor’s 500 (S&P 500) has hit a 5 year high and the Russell 2000 index hit an all-time record high of 879.15 by closing up a whopping 5.65%! See more return information below.

By now you know the Fiscal Cliff deal was struck and all of the details are widely reported – so I won’t bother with them here.
There was some good economic news last week with the Institute for Supply Management (ISM) Manufacturing and Non-Manufacturing December reports out. Reports with readings higher than 50 generally signify expansion & growth rather than contraction. The ISM Manufacturing reported a better than expected reading of 50.7 (vs the expected 50.5) while the ISM Non-Manufacturing reported a reading of 56.1, which is the highest reading since last February.
 So, welcome to 2013. It’s important to remember that even though many investors think 2012 was a bad year for the economy, it was not a bad year for the markets. In fact, an interesting stat provided by Bespoke Investment Group is that 2012 was a year that had the S&P 500 up on a year to date basis every single day of the year. This means it never closed below the 2011 closing level once the whole year. That’s only happened 8 times in history and 1979 was the last year that it did. This has only happened back-to-back one time in history and that was 1975-1976. Last week’s market return provided a serious tailwind for that possibility to repeat itself for a second time. Stay tuned.
Are you curious about how well the S&P 500 does the year AFTER an “all up year” like 2012? Well, Bespoke provided us with that stat too… The S&P 500 gains 10.52% on average and of the 8 times, only one following year had a negative return. 1976.
We will have our 2012 Review completed soon and we’ll let you know how to access it in an upcoming blog.
Please call or email with questions.
IMPORTANT NOTE: Due to industry regulations, comments are not permitted on this blog. If you would like to contact the author, please email us at info@monumentwm.com.
Securities offered through LPL Financial, Member FINRA/SIPC. Investment advice offered through Monument Advisory Group, LLC, a registered investment advisor. Monument Advisory Group, LLC, and Monument Wealth Management are separate entities from LPL Financial.
The opinions voiced in this material are for general information only and are not intended to provide specific advice or recommendations for any individual. To determine which investment(s) may be appropriate for you, consult your financial advisor prior to investing. All performance referenced is historical and is no guarantee of future results. All indices are unmanaged and cannot be invested into directly. Stock investing involves risk including loss of principal. The Dow Jones Industrial Average is comprised of 30 stocks that are major factors in their industries, and widely held by individuals and institutional investors. The Standard & Poor’s 500 Stock Index (S&P 500) is an unmanaged capitalization weighted index of 500 stocks designed to measure performance of the broad domestic economy through changes in the aggregate market value of 500 stocks representing all major industries. The NASDAQ Composite Index measures all domestic and non-U.S. based common stocks listed on The NASDAQ Stock Market. The market value, the last sale price multiplied by total shares outstanding, is calculated throughout the trading day, and is related to the total value of the Index. The Russell 2000 Small Stock Index is an unmanaged index generally representative of the 2000 smallest companies in the Russell 3000 Index. The Russell 2000 is an unmanaged index generally comprised of companies with lower price-to-book ratios and lower forecasted growth values. The 2, 10 and 30 year Treasury is simply the yield at the close of the day.
(1) West Texas Intermediate crude spot price is as of end of week.
(2) London Bullion Market Association; gold fixing pricing at 3 p.m. London time.

David B. Armstrong, CFA
President & Co-Founder
Dave got into the industry when he discovered his passion for finance in his mid-20’s. He’s a combat veteran and served as an officer in the United States Marines Corps on both active duty and in the reserves, retiring at the rank of Lieutenant Colonel. While serving on active duty, Dave was unable to spend money on deployments, so he became a self-taught investor. Along with a few bucks cash as a bouncer, his investing performance grew to be good....
IMPORTANT DISCLOSURE INFORMATION
Please remember that past performance is no guarantee of future results. Different types of investments involve varying degrees of risk, and there can be no assurance that the future performance of any specific investment, investment strategy, or product (including the investments and/or investment strategies recommended or undertaken by Monument Capital Management, LLC [“Monument”]), or any non-investment related content, made reference to directly or indirectly in this blog will be profitable, equal any corresponding indicated historical performance level(s), be suitable for your portfolio or individual situation, or prove successful. Due to various factors, including changing market conditions and/or applicable laws, the content may no longer be reflective of current opinions or positions. Moreover, you should not assume that any discussion or information contained in this blog serves as the receipt of, or as a substitute for, personalized investment advice from Monument. To the extent that a reader has any questions regarding the applicability of any specific issue discussed above to his/her individual situation, he/she is encouraged to consult with the professional advisor of his/her choosing. No amount of prior experience or success should be construed that a certain level of results or satisfaction will be achieved if Monument is engaged, or continues to be engaged, to provide investment advisory services. Monument is neither a law firm nor a certified public accounting firm and no portion of the blog content should be construed as legal or accounting advice.
A copy of Monument’s current written disclosure Brochure discussing our advisory services and fees is available for review upon request or at www.monumentwealthmanagement.com/disclosures. Please Note: Monument does not make any representations or warranties as to the accuracy, timeliness, suitability, completeness, or relevance of any information prepared by any unaffiliated third party, whether linked to Monument’s website or blog or incorporated herein, and takes no responsibility for any such content. All such information is provided solely for convenience purposes only and all users thereof should be guided accordingly.
Historical performance results for investment indices, benchmarks, and/or categories have been provided for general informational/comparison purposes only, and generally do not reflect the deduction of transaction and/or custodial charges, the deduction of an investment management fee, nor the impact of taxes, the incurrence of which would have the effect of decreasing historical performance results. It should not be assumed that your Monument account holdings correspond directly to any comparative indices or categories. Please Also Note: (1) performance results do not reflect the impact of taxes; (2) comparative benchmarks/indices may be more or less volatile than your Monument accounts; and, (3) a description of each comparative benchmark/index is available upon request.
Please Remember: If you are a Monument client, please contact Monument, in writing, if there are any changes in your personal/financial situation or investment objectives for the purpose of reviewing/evaluating/revising our previous recommendations and/or services, or if you would like to impose, add, or to modify any reasonable restrictions to our investment advisory services. Unless, and until, you notify us, in writing, to the contrary, we shall continue to provide services as we do currently. Please Also Remember to advise us if you have not been receiving account statements (at least quarterly) from the account custodian.