Our “Off The Wall” Blog
is now Monument #Unfiltered
Subscribe below to receive our unique, straight-forward, unfiltered wealth advice delivered straight to your inbox.
Summer, Summer, Summertime

Last week saw a big drop for tech, which dragged the Nasdaq down 1.8%…its third worst day of the year, and worst week year-to-date (-1.5%). What made this big drop so distinctive? It came the day after setting a new all-time high.
Other than a 2.6% drop in May, (yes, the year is almost half over…) you have to go all the way back to March of 2000 to find the last time the Nasdaq saw a larger drop from an all-time high.
If you read through this amazing blog, you will see I have a good old memory jogger from that era. Man, I’m old… I just used the word “era”.
I’m seeing a ton of charts that say something along the lines of, “Are We About to See Another 1987?” For example, see this chart below.
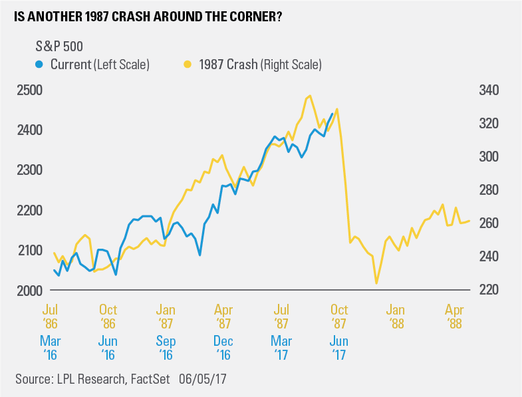
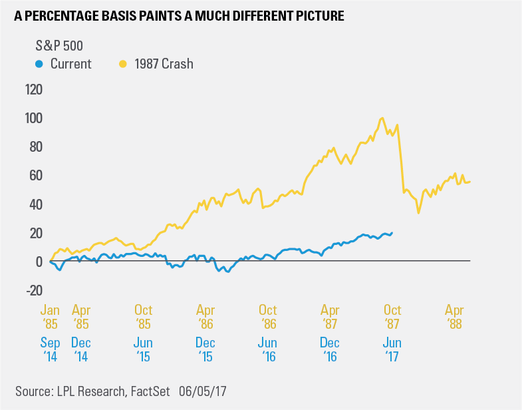
Comparing one price chart to another doesn’t indicate a thing…
Don’t fall for “no banana in the tailpipe”.

Summer, Summer, Summertime…

Dorsey Wright & Associates published a research report early June to identify any particular months that affect the summertime returns. They compiled a monthly summary of S&P 500 returns going back to 1958.
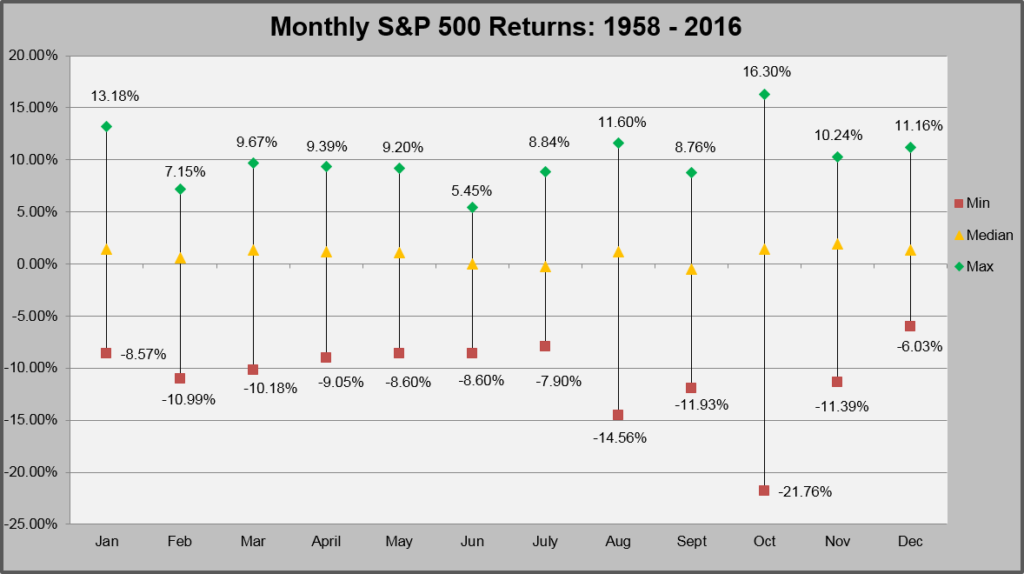
What they found was that the summer months, June, July and August, tend to have a lower median return (the yellow triangle) than most of the other months of the year. Interestingly, the month of September was the one that that has historically provided the lowest median return, clocking in at -0.49%.
However, September is closely followed by both July (-0.22%) and June (0.01%).
August’s median return comes in as the 6th worst month.
What is interesting is that the spread between the max return in a given month versus the minimum return in a given month is actually pretty low in the Summer (namely June and July) compared to the rest of the months.
Take a look at June. June has a max return of 5.45% in the last 59 years, while every other month except February reached at least 8%…clearly June hasn’t been able to achieve the upside compared with other months.
However, it’s not just the month of June. You’ll see the opposite going on in August, which participated to the downside more than every month except October. The worst August observed experienced a loss of -14.56%. This is significant when compared to the other months’ minimums, which clock in around -10% (except October).
The point is that while you will hear a lot about the summer doldrums (the old “Sell in May and Go Away” adage), the data seem to support that the gloom cannot necessarily be contained in just one of the three months.
What Does That Mean for You?
Hopefully nothing, because you are an investor with a plan and not a trader. What this means for you is that you may see some volatility combined with flat returns and you just need to chill and stick to your plan. None of this can be used to forecast, so the best course of action is to determine if you need cash for something over the next year. If so, the market is at a high and if you raise the cash now you won’t be unhappy.
Speaking of the Market
It’s that time again to remind everyone about the S&P 500. There is no perfect equity benchmark for comparing your portfolio returns. The S&P is often quoted in the press and it’s not a bad one. We use it a lot when discussing the overall market. It has good and bad qualities…
The Good: It has 500 stocks, covers large, mid and small caps and includes some U.S. companies that derive some revenue from overseas (emphasis – SOME).
The Bad: While it has 500 stocks, it is market cap weighted. This means that the stocks with the highest market cap have the most “power” over the moves in the index than smaller capitalization stocks. This means that Apple ($762.5b) is going to have much more “power” over the index going up and down every day than, say, AutoZone ($4.3b).
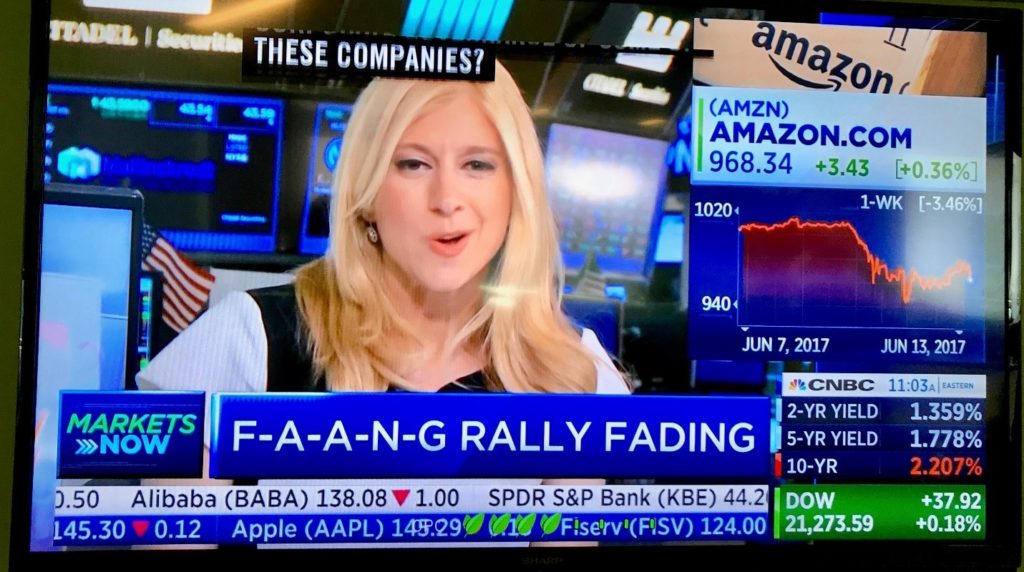
Here’s the thing you need to be aware of – if you focus on “the market” as defined as the S&P 500, you need to know that the largest of the large stocks in the S&P 500 (Apple, Google, Netflix, Amazon and Facebook) are up big this year and are carrying the index. They are up on a percentage basis year-to-date of +26.28, +22.92, +22.46, +30.26, and +30.62, respectively (Source: FactSet).
These stocks are often referred to as FAANG stocks: Facebook, Apple, Amazon, Netflix and Google.
Now don’t get it twisted – those are good returns for individual stocks and if you own them, you are happy (or if an ETF that you own includes them, you are happy, too).
However, here are the P/E ratios today: 16.99x, 32.56x, 198.18x, 182.15x, and 39.43x, respectively (Source: FactSet). Compare those P/E’s against the charted P/E’s below for the S&P 500, which shows the P/E based on the last 12 months’ actual earnings (LTM in yellow) and the projected next 12 months (forward) earnings (NTM in Blue) at 20.69x and 17.71x, respectively.
Crash course – P/E ratio (the Price to earnings ratio) shows you how many dollars you will pay in order to get a dollar of the company’s earnings. It’s called a “multiple” and stated like this, “The S&P 500 is trading at 17.71 times forward earnings,” where the word “times” is expressed with an “x”.
Notice how the only stock even close in P/E is Apple at 16.99x? The next closest is almost double – Google at 32.56x.
The only reason you’d spend $198 for $1 of earnings versus $17 for $1 of earnings is because you believe that value of the of the $198 stock will continue to increase. At some point that rational turns the other way…
Bonus – See the chart of Cisco from 1990 to June of 2001, below. The first is the price chart from January 1st, 1990 to June 1st, 2001. The second is the P/E ratio over the same time. Pay attention to the P/E high of 225x.
See my point?
Stocks get expensive – sometimes ridiculously so.
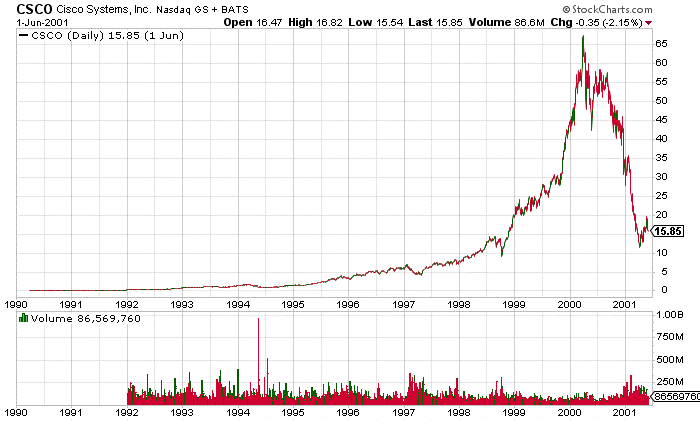
(Thanks to FactSet for the chart above and below.)
As those stocks keep going up in value, their market cap increases (market cap = stock price * total shares outstanding) and they have more and more “power”, which can become dangerous when markets reverse.
Very dangerous…
Right now, by my calculations, 50 stocks equal roughly 50% of the total weighting of the S&P 500…meaning the other 50% weighting is allocated across the 450 remaining stocks.
Remember, the S&P 500 may be 500 stocks, but it is not as well diversified as you may think. A well-diversified portfolio is globally diversified across different economies, styles and sectors. That is a lot different than one index heavily weighted towards the top 10, 25 or even 50 stocks.
If your equity portfolios are performing close to the S&P 500 without these stocks, that’s pretty good.
If you take a well-diversified portfolio and start stretching to meet the S&P 500 returns by adding risk, YOU ARE ADDING RISK TO A DIVERSIFIED PORTFOLIO.
Be careful in these times trying to benchmark the S&P 500…
Give us a call with any questions.

Important Disclosure Information
Please remember that past performance may not be indicative of future results. Different types of investments involve varying degrees of risk, and there can be no assurance that the future performance of any specific investment, investment strategy, or product (including the investments and/or investment strategies recommended or undertaken by Monument Wealth Management), or any non-investment related content, made reference to directly or indirectly in this blog will be profitable, equal any corresponding indicated historical performance level(s), be suitable for your portfolio or individual situation, or prove successful. All indexes referenced are unmanaged and cannot be invested into directly. The economic forecasts set forth may not develop as predicted. Due to various factors, including changing market conditions and/or applicable laws, the content may no longer be reflective of current opinions or positions. Moreover, you should not assume that any discussion or information contained in this blog serves as the receipt of, or as a substitute for, personalized investment advice from Monument Wealth Management. To the extent that a reader has any questions regarding the applicability of any specific issue discussed above to his/her individual situation, he/she is encouraged to consult with the professional advisor of his/her choosing. Monument Wealth Management is neither a law firm nor a certified public accounting firm and no portion of the blog content should be construed as legal or accounting advice. A copy of Monument Wealth Management’s current written disclosure statement discussing our advisory services and fees is available for review upon request.

David B. Armstrong, CFA
President & Co-Founder
Dave got into the industry when he discovered his passion for finance in his mid-20’s. He’s a combat veteran and served as an officer in the United States Marines Corps on both active duty and in the reserves, retiring at the rank of Lieutenant Colonel. While serving on active duty, Dave was unable to spend money on deployments, so he became a self-taught investor. Along with a few bucks cash as a bouncer, his investing performance grew to be good....
IMPORTANT DISCLOSURE INFORMATION
Please remember that past performance is no guarantee of future results. Different types of investments involve varying degrees of risk, and there can be no assurance that the future performance of any specific investment, investment strategy, or product (including the investments and/or investment strategies recommended or undertaken by Monument Capital Management, LLC [“Monument”]), or any non-investment related content, made reference to directly or indirectly in this blog will be profitable, equal any corresponding indicated historical performance level(s), be suitable for your portfolio or individual situation, or prove successful. Due to various factors, including changing market conditions and/or applicable laws, the content may no longer be reflective of current opinions or positions. Moreover, you should not assume that any discussion or information contained in this blog serves as the receipt of, or as a substitute for, personalized investment advice from Monument. To the extent that a reader has any questions regarding the applicability of any specific issue discussed above to his/her individual situation, he/she is encouraged to consult with the professional advisor of his/her choosing. No amount of prior experience or success should be construed that a certain level of results or satisfaction will be achieved if Monument is engaged, or continues to be engaged, to provide investment advisory services. Monument is neither a law firm nor a certified public accounting firm and no portion of the blog content should be construed as legal or accounting advice.
A copy of Monument’s current written disclosure Brochure discussing our advisory services and fees is available for review upon request or at www.monumentwealthmanagement.com/disclosures. Please Note: Monument does not make any representations or warranties as to the accuracy, timeliness, suitability, completeness, or relevance of any information prepared by any unaffiliated third party, whether linked to Monument’s website or blog or incorporated herein, and takes no responsibility for any such content. All such information is provided solely for convenience purposes only and all users thereof should be guided accordingly.
Historical performance results for investment indices, benchmarks, and/or categories have been provided for general informational/comparison purposes only, and generally do not reflect the deduction of transaction and/or custodial charges, the deduction of an investment management fee, nor the impact of taxes, the incurrence of which would have the effect of decreasing historical performance results. It should not be assumed that your Monument account holdings correspond directly to any comparative indices or categories. Please Also Note: (1) performance results do not reflect the impact of taxes; (2) comparative benchmarks/indices may be more or less volatile than your Monument accounts; and, (3) a description of each comparative benchmark/index is available upon request.
Please Remember: If you are a Monument client, please contact Monument, in writing, if there are any changes in your personal/financial situation or investment objectives for the purpose of reviewing/evaluating/revising our previous recommendations and/or services, or if you would like to impose, add, or to modify any reasonable restrictions to our investment advisory services. Unless, and until, you notify us, in writing, to the contrary, we shall continue to provide services as we do currently. Please Also Remember to advise us if you have not been receiving account statements (at least quarterly) from the account custodian.