Our “Off The Wall” Blog
is now Monument #Unfiltered
Subscribe below to receive our unique, straight-forward, unfiltered wealth advice delivered straight to your inbox.
Summer – Goodbye, I Hardly Knew Ya.

I took a two week break from blogging as I attended a great industry conference on the west coast and then had knee surgery to reconstruct a torn ACL in my knee. I was making such good progress on my golf game and then that happened. Summer is now over, my knee has more colors than a Jackson Pollock painting and the next thing you know we’ll be setting the clocks back and driving in the dark at 4:30pm.
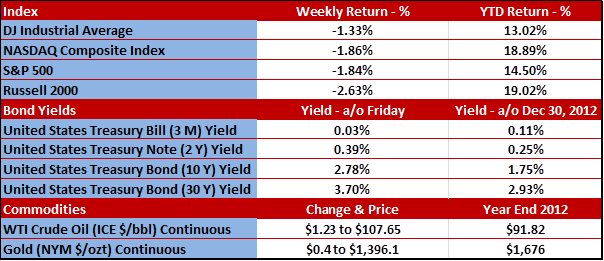
August is usually a pretty slow month for the markets. Trading volume is light and a lot of people are on vacation. For the month, the Standard & Poor’s 500 Index (S&P 500) was down -3.1%. That’s rough, but not catastrophic given the fact that the S&P 500 is up +14.5% YTD through August and hit its all-time closing high on August 2nd. Looking at September, it is usually the weakest month of the year for the equities.
See below for more info on the market last week.
Economic Reports and Other News (Have you heard about Syria!?)
Unless you have been completely unplugged over the past week, there is a lot of talk about the U.S. bombing Syria because Syria bombed Syria. I won’t get into the politics of this but it has caused a little bit of volatility in the U.S. equity markets and with the price of oil. Two things about oil:
- Syrian output of oil is not the issue.
- It’s the recent reduction in output from Libya that has cause the rise in prices.
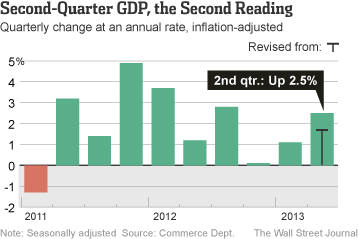
Three cheers for the revised Second-Quarter GDP! As you may know, the first report on any quarter of GDP is never the LAST reading on that quarter’s GDP. The initial report came with GDP at a measly 1.7% but was revised UP last week to 2.5%! Not bad. Here’s a graphic from the August 30, 2013 edition of the Wall Street Journal.
Economic reports will be numerous this shortened holiday week, 25 in all. The ISM Manufacturing Report released this morning showed U.S. manufacturers expanded in August at the fastest pace in more than two years. This closely followed index rose from 55.4% to 55.7% in July when most economists were predicting it to shrink down to 54.1%. Any number above 50% indicates that manufacturers are expanding. We will see ISM Non-Manufacturing (Services) on Thursday and several employment reports on Friday.
So while there is still some general lack of confidence in the economy (for example, jobs are still not great and the GDP is still anemic), it’s not all gloomy and there have been pockets of strength. Housing is well off the bottom, auto sales have been strong, and we can’t ignore the shale oil and gas revolution, which is creating wealth and spurring investment in infrastructure that’s needed to move this new U.S. oil production.
Over the next month we will probably see answers to the following questions: Who will replace Bernanke when his second term expires at year-end? How will the upcoming debate over raising the U.S. debt ceiling impact markets and politics? Will we see any evidence that the economy is gaining steam? Will troubles in emerging markets fade? How might Europe’s burgeoning recovery proceed?
Stay tuned and please call or email with questions.
Investment advice offered through Monument Advisory Group, LLC a Registered Investment Advisor (RIA). Securities offered through LPL Financial. Member FINRA/SIPC. Monument Advisory Group and Monument Wealth Management are separate entities from LPL Financial.
The opinions voiced in this material are for general information only and are not intended to provide specific advice or recommendations for any individual. To determine which investment(s) may be appropriate for you, consult your financial advisor prior to investing. All performance referenced is historical and is no guarantee of future results. All indices are unmanaged and cannot be invested into directly. Stock investing involves risk including loss of principal. The Dow Jones Industrial Average is comprised of 30 stocks that are major factors in their industries, and widely held by individuals and institutional investors. The Standard & Poor’s 500 Stock Index (S&P 500) is an unmanaged capitalization weighted index of 500 stocks designed to measure performance of the broad domestic economy through changes in the aggregate market value of 500 stocks representing all major industries. The NASDAQ Composite Index measures all domestic and non-U.S. based common stocks listed on The NASDAQ Stock Market. The market value, the last sale price multiplied by total shares outstanding, is calculated throughout the trading day, and is related to the total value of the Index. The Russell 2000 Small Stock Index is an unmanaged index generally representative of the 2000 smallest companies in the Russell 3000 Index. The Russell 2000 is an unmanaged index generally comprised of companies with lower price-to-book ratios and lower forecasted growth values. The 2, 10 and 30 year Treasury is simply the yield at the close of the day.
(1) West Texas Intermediate crude spot price is as of end of week.
(2) London Bullion Market Association; gold fixing pricing at 3 p.m. London time.

David B. Armstrong, CFA
President & Co-Founder
Dave got into the industry when he discovered his passion for finance in his mid-20’s. He’s a combat veteran and served as an officer in the United States Marines Corps on both active duty and in the reserves, retiring at the rank of Lieutenant Colonel. While serving on active duty, Dave was unable to spend money on deployments, so he became a self-taught investor. Along with a few bucks cash as a bouncer, his investing performance grew to be good....
IMPORTANT DISCLOSURE INFORMATION
Please remember that past performance is no guarantee of future results. Different types of investments involve varying degrees of risk, and there can be no assurance that the future performance of any specific investment, investment strategy, or product (including the investments and/or investment strategies recommended or undertaken by Monument Capital Management, LLC [“Monument”]), or any non-investment related content, made reference to directly or indirectly in this blog will be profitable, equal any corresponding indicated historical performance level(s), be suitable for your portfolio or individual situation, or prove successful. Due to various factors, including changing market conditions and/or applicable laws, the content may no longer be reflective of current opinions or positions. Moreover, you should not assume that any discussion or information contained in this blog serves as the receipt of, or as a substitute for, personalized investment advice from Monument. To the extent that a reader has any questions regarding the applicability of any specific issue discussed above to his/her individual situation, he/she is encouraged to consult with the professional advisor of his/her choosing. No amount of prior experience or success should be construed that a certain level of results or satisfaction will be achieved if Monument is engaged, or continues to be engaged, to provide investment advisory services. Monument is neither a law firm nor a certified public accounting firm and no portion of the blog content should be construed as legal or accounting advice.
A copy of Monument’s current written disclosure Brochure discussing our advisory services and fees is available for review upon request or at www.monumentwealthmanagement.com/disclosures. Please Note: Monument does not make any representations or warranties as to the accuracy, timeliness, suitability, completeness, or relevance of any information prepared by any unaffiliated third party, whether linked to Monument’s website or blog or incorporated herein, and takes no responsibility for any such content. All such information is provided solely for convenience purposes only and all users thereof should be guided accordingly.
Historical performance results for investment indices, benchmarks, and/or categories have been provided for general informational/comparison purposes only, and generally do not reflect the deduction of transaction and/or custodial charges, the deduction of an investment management fee, nor the impact of taxes, the incurrence of which would have the effect of decreasing historical performance results. It should not be assumed that your Monument account holdings correspond directly to any comparative indices or categories. Please Also Note: (1) performance results do not reflect the impact of taxes; (2) comparative benchmarks/indices may be more or less volatile than your Monument accounts; and, (3) a description of each comparative benchmark/index is available upon request.
Please Remember: If you are a Monument client, please contact Monument, in writing, if there are any changes in your personal/financial situation or investment objectives for the purpose of reviewing/evaluating/revising our previous recommendations and/or services, or if you would like to impose, add, or to modify any reasonable restrictions to our investment advisory services. Unless, and until, you notify us, in writing, to the contrary, we shall continue to provide services as we do currently. Please Also Remember to advise us if you have not been receiving account statements (at least quarterly) from the account custodian.