It’s been a heck of a start to the year. The S&P 500 is already down over 2.7% through Wednesday’s close and as of this writing at 10am on Thursday, January 7th, it’s down another 1.5%. If the market were to close right this second, the YTD loss would be around 4.2% YTD.
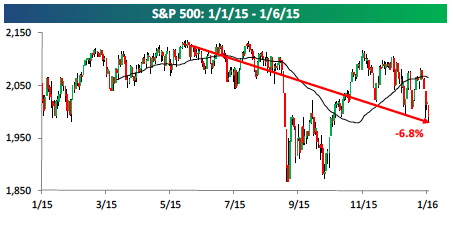
The last intraday high set in the S&P 500 was last May and through yesterday’s close, it is down 6.8% from that high. (Chart from Bespoke)
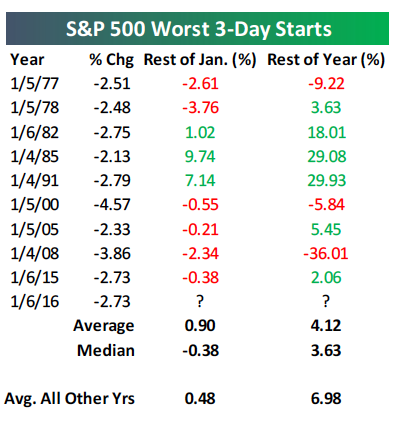
While that seems like a big deal in the current snapshot of time (and I’m not trying to be flippant here, I’m just saying…), if you look at the larger picture, it’s not as big of a deal as everyone’s making out to be. In fact, the first three trading days of a year not too long ago was also down 2.7%.
What year was that you ask? January of 2015.
Yup – it’s true. But sometimes snapshots in time seem like a big deal and then they don’t. Here’s another Bespoke chart with data on the worst three-day starts.
The bigger and more important question that everyone is probably asking is, “IS THIS A SIGN OR A SIGNAL of something really bad starting?”
I don’t think so. But before I get into my reasons why, let’s review what’s been happening over the short-term.
China
China’s market was down around 7% on Monday which caused their “circuit breakers” to kick in, resulting in an ugly, shortened day. From there, the sell-off quickly spilled over into global markets. The 7% decline was blamed on a drop in China’s Manufacturing Index (the Caixin Manufacturing PMI), which fell from 48.6 in November to 48.2 in December, when most economists were predicting a reading of 49.0. Just like our ISM reports, a reading of 50 is neutral.
(Sidebar: GIVE ME A BREAK! Something like this SHOULD NOT be triggering a 7% drop unless people are panicking.)
There were also some conflicting messages coming out of China’s central bank, (Imagine that! China is not being transparent or clear with central bank messaging!), alongside expectations that some measures China implemented to slow down selling last year may soon expire.
The Wall Street Journal reported on a surprise decision by China’s central bank not to renew a line of credit to China Development Bank. My guess is that this is more likely the culprit of the 7% sell-off.
Friction between Saudi Arabia and Iran is increasing, suppressing some conjecture that the Organization of the Petroleum Exporting Countries (OPEC) could agree to production curbs. Oil ended Wednesday down 5% to nearly $34 per barrel.
North Korea claims it successfully tested a hydrogen bomb early this morning, generating a new round of geopolitical uncertainties. Boom. As if there has been any geopolitical certainty in Korea since the mid-1950s…
U.S. Economic Data
The December ISM Manufacturing Index released Monday pointed to more problems in the sector, but the ISM Services Index paints a more optimistic picture. More on that below. So although December was not a good month for manufacturing, job creation in most other industries made December the number one month in 2015 for employment growth, according to Monday’s ADP Employment Report. And while December’s employment report will take center stage on Friday, a surprisingly strong 257k rise in the December ADP Employment Report is encouraging.
My Thoughts
Despite the three-day sell-off, a volatility index (VIX) of around 20 isn’t pointing to panic selling. Neither is the modest volume we have seen over the same time.
In the long-term, U.S. stocks follow the fundamentals at home. North Korea’s detonation can’t be dismissed, but geopolitical tensions typically influence sentiment over the short term…this has been going on since the FIFTIES. I think by the time they have the technology to shoot off an intercontinental nuke, we will have built the technology to shoot it down five seconds after it launches – just my hunch.
Earnings season officially kicks off next week. Earnings are a BIG DEAL. I think the fourth quarter (Q4) earnings will be weak, but that’s already expected which is why the market was flat-to-down over the last part of 2015. However, earnings are forecast to begin rising in Q1. The direction of oil and the dollar will play a role, but energy’s impact on earnings is set to fade. I think there is a larger probability that we start to see an offset from this oil. I’m making a bet that we will see reports by airlines that are very surprising and car sales will be up, too. Airfare is the same and oil is at $34…draw your own conclusions but you can probably guess mine.
With regards to economic growth, let’s consider GDP and the recent ISM reports on Manufacturing and Services. The two reports are often blended together to form what is called the ISM Composite Index. Currently, the composite is suggesting Q4 GDP to come in around the 2 – 2.5% range. There are no guarantees of course, but it’s a respectable gage and leads me to believe that we are not staring over a cliff at some sort of recession or the brink of disaster. I think modest growth is the most likely path for the economy and that lends support to stocks.
Finally, if you are REALLY CONCERNED about what has been happening:
- PLEASE GO RE-READ THIS BLOG from August 24th, 2015 titled “What Should I Do Now?” Pay particular attention to the chart by Dr. David Kelly, CFA from JP Morgan in the beginning. Actually, PAY ATTENTION TO THE WHOLE BLOG.
- Then PLEASE GO WATCH THIS THREE PART VIDEO.
This current situation is not a sign or a signal that people should be taking any evasive or aggressive action. It’s the equity market – it goes up and down, sometimes a little and sometimes a lot. If you don’t feel like you can ride it out, you have probably miscalculated your tolerance for risk. Call someone and fix that.
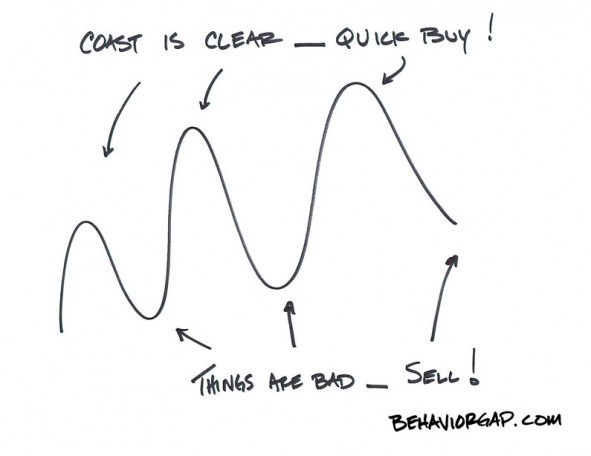
I’ll end with this complicated chart from Carl Richards. The squiggly line represents the market. He’s written a great book called “The One-Page Financial Plan”. See his webpage here.
Important Disclosure Information
Please remember that past performance may not be indicative of future results. Different types of investments involve varying degrees of risk, and there can be no assurance that the future performance of any specific investment, investment strategy, or product (including the investments and/or investment strategies recommended or undertaken by Monument Wealth Management), or any non-investment related content, made reference to directly or indirectly in this blog will be profitable, equal any corresponding indicated historical performance level(s), be suitable for your portfolio or individual situation, or prove successful. All indexes referenced are unmanaged and cannot be invested into directly. The economic forecasts set forth may not develop as predicted. Due to various factors, including changing market conditions and/or applicable laws, the content may no longer be reflective of current opinions or positions. Moreover, you should not assume that any discussion or information contained in this blog serves as the receipt of, or as a substitute for, personalized investment advice from Monument Wealth Management. To the extent that a reader has any questions regarding the applicability of any specific issue discussed above to his/her individual situation, he/she is encouraged to consult with the professional advisor of his/her choosing. Monument Wealth Management is neither a law firm nor a certified public accounting firm and no portion of the blog content should be construed as legal or accounting advice. A copy of Monument Wealth Management’s current written disclosure statement discussing our advisory services and fees is available for review upon request.