Well, the first quarter of 2016 is in the books. I thought I’d start with a quote:
“And when it’s over, I press rewind though.” – Fetty Wap
Oh wait – I meant these quotes…
“You are not able to predict what will happen nor when it will happen…and neither am I.
Only charlatans and fools believe this is actually possible. I reminded everyone of this many times, including in this November, 2015 blog post and this U.S. News and World Report Column I wrote back in, oh, let’s see…2013.
Probabilities and statistics are on the side of the patient investor who sticks with a plan…but let me get back to my thoughts on 2015 before I get too far off on a tangent.”
Oh…and I said that. On January 4th. Of this year. Here’s the proof.
No one predicted what we just experienced. By February 11th, 2016 (basically the middle of the first quarter) the S&P 500 was down over 10% for the year, logging the worst start to a calendar year in history.
But then by the end of the quarter, the S&P 500 had not only recovered, but it was POSITIVE and declared one of the biggest quarterly reversals since 1933.
Yeah, 1933 – when the average cost of a home was $5,750. Now, a new outdoor table from Pottery Barn will cost you $5,750.
I concluded the January 4th blog with the following:
“My recommendations for investors in 2016 are:
1. Have a long-term financial plan and an appropriate investment strategy that supports that plan.
2. You should have access to cash to meet your liquidity needs for12-18 months so you are not forced to panic or make emotional reactions to market pull backs like we saw last summer, or in 2012…or 2011…or 2008/9.
3. Stay invested in sectors of the market which, during the expansion phase of the economic cycle, have a higher probability of outperforming others.
I catch a fair amount of good natured ribbing for espousing the same advice over and over. I get it, a lot of people expect folks in my business to always be “doing something.”
I like defending myself when I’m right…or at least, not wrong…but the reality is that “doing something” seems stupid to me when for the last eight years we have not seen a whole lot of change. We continue to see low interest rates, low inflation, modest GDP growth, and no over-spending, over-confidence or over-borrowing. Not much has changed, except oil prices are putting a lot of money back into consumers’ pockets.”
I don’t think it was bad advice. Be sure to take a look back at our Economic Update Video from earlier this year. We still don’t see a recession on the horizon. I mean, we will have a recession at some point in the future, I just don’t think it is going to be any time soon. In order to see a recession, I think we will need a lot of different economic data that get summed up into 3 generic things:
1. Over-borrowing
2. Over-spending
3. Over-confidence
I still don’t see those things right now. In fact, we have seen recent signs of good economic data such as consistent job gains, wage growth and solid consumer spending. Last Friday we learned that U.S. employers added 215,000 jobs in March and while the unemployment rate moved up to 5%, that was a function of more Americans entering/reentering the labor force.
Here’s how the math works using small numbers:
If 700 people are working and there are 750 people in the labor force, then 93.3% of the labor force is employed (700/750)… and 6.7% are unemployed.
If 5 more people enter the work force, then 700/755 = 92.7% that are employed and the unemployment rate bumps up to 7.3%.
So now you can see how the unemployment rate bumps up when more people enter the work force.
First Quarter (Q1) Portfolio Performance
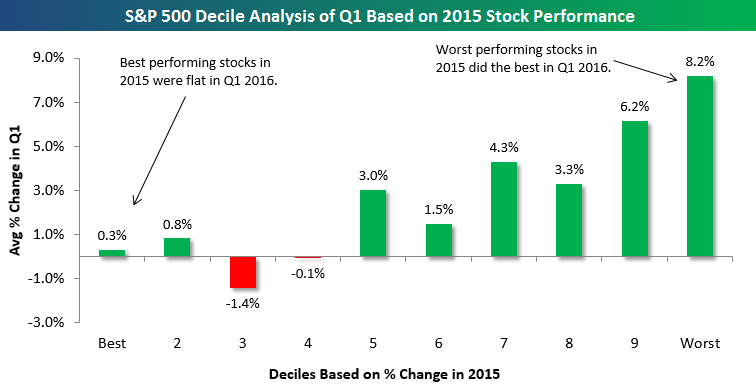
Wondering why the market was up for Q1 2016 and your portfolio was… “meh”? The chart below from Bespoke may shed some light on things.

Bespoke conducted an interesting analysis by breaking the S&P 500 into deciles (10 groups of 50 stocks each) based on 2015 stock performance. In the chart above, decile 1 contains the 50 S&P 500 stocks that did the BEST in 2015, decile 2 contains the next best 50…you get the point…all the way to decile 10, which contains the 50 stocks in the S&P that did the WORST in 2015.
They then went on to determine the Q1 2016 return for each stock in each decile. From there they calculated the average Q1 change for all stocks in each decile.
Basically, if your portfolio held the top 200 performing stocks of 2015 (decile 1-4), you were most likely flat for Q1.
The best performing stock in the S&P 500 for Q1 was up about 53% while the worst was down -54%, so if you owned those two with a 50/50 split, you were probably flat too.
Earnings and the Dollar
There is good and bad to a strong U.S. Dollar (USD). You can take cheap trips overseas and buy more stuff there. It keeps the prices of imported goods low, too…like French red wine.
But it’s a double edged knife since it works against U.S. manufacturers by making it more difficult for them to raise prices. It also works against companies that export goods overseas because they face a more competitive environment.
From an investing perspective, the strong USD has dampened the revenues of larger companies that do a significant amount of business overseas. Since sales outside the U.S. must be converted back into more expensive USD, it comes right off the bottom line.
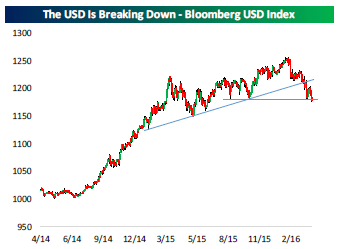
But recently, we’ve seen the dollar begin to weaken…not a ton, but enough. So while the rise in oil prices over the last six weeks has been largely credited with helping stocks, people are now taking notice of what’s been going on with the USD. See the Bespoke chart below.

As the weaker USD reduces headwinds from the large U.S. multinationals heading into earnings season, (scheduled to report Q1 earnings in April and May), it will be interesting to see how it impacts the bottom line of companies. Economic growth is obviously the key to long-term profit growth, but we will be watching to see if the recent weakening of the USD will potentially trickle its way down into earnings pretty quickly.
Stay tuned for that.
Please call with questions.

Important Disclosure Information for “Quarterly Review – Monument Style”
Please remember that past performance may not be indicative of future results. Different types of investments involve varying degrees of risk, and there can be no assurance that the future performance of any specific investment, investment strategy, or product (including the investments and/or investment strategies recommended or undertaken by Monument Wealth Management), or any non-investment related content, made reference to directly or indirectly in this blog will be profitable, equal any corresponding indicated historical performance level(s), be suitable for your portfolio or individual situation, or prove successful. All indexes referenced are unmanaged and cannot be invested into directly. The economic forecasts set forth may not develop as predicted. Due to various factors, including changing market conditions and/or applicable laws, the content may no longer be reflective of current opinions or positions. Moreover, you should not assume that any discussion or information contained in this blog serves as the receipt of, or as a substitute for, personalized investment advice from Monument Wealth Management. To the extent that a reader has any questions regarding the applicability of any specific issue discussed above to his/her individual situation, he/she is encouraged to consult with the professional advisor of his/her choosing. Monument Wealth Management is neither a law firm nor a certified public accounting firm and no portion of the blog content should be construed as legal or accounting advice. A copy of Monument Wealth Management’s current written disclosure statement discussing our advisory services and fees is available for review upon request.


