Our “Off The Wall” Blog
is now Monument #Unfiltered
Subscribe below to receive our unique, straight-forward, unfiltered wealth advice delivered straight to your inbox.
“Nothing, For The Most Part, Surprises Me Anymore”

Brett Favre is credited with that quote but I suspect even he was surprised by the Fed last week when they stunned everyone, including the entire crew here at MWM, with their decision not to taper last week. The reaction on the Street was immediate. Read on.
The Fed Announcement
U.S. and global stocks surged on the news Wednesday with the Standard & Poor’s 500 index (S&P 500) and the Dow Jones Industrials both closing at new highs while bond prices rose sharply and yields fell. It was interesting that the Fed’s lack of confidence in the economy helped stocks at first but by the end of the week shares were off the Wednesday closing highs.
There were several reasons for the Fed’s decision to delay a reduction.
First – The Fed is worried that the sharp increase in mortgage rates over the last couple of months could dull the economic recovery and dampen some of the enthusiasm we’ve been seeing in housing. Housing and cars really have a huge impact on the economy.
Second – The Fed is concerned that the sequester and recent tax hikes may be hurting economic growth. On top of that, the looming budget (political) battles in Washington could hurt the economy… Not to mention the markets!
Third – The Fed’s statement released at the conclusion of its meeting acknowledged “the improvement in economic activity and labor market conditions,” but it wants to wait for “more evidence that progress will be sustained before adjusting the pace of its (bond) purchases.”
Fourth – Yellen may already be calling the shots and she got her way at the last meeting. But that’s speculation since we still don’t know if she’s got the job.
So what happened? Bernanke laid out a pretty clear strategy during the famous June press conference when he said he expected a reduction in purchases in the fall (translation – September), with measured cutbacks continuing into the winter, possibly ending by mid-2014 when the unemployment rate could be in “the vicinity of 7%.”
At the June meeting, the unemployment rate stood at 7.6%, and has since fallen to 7.3%. That’s pretty close to 7% by the way.
At the press conference on Wednesday, Bernanke noted the unemployment rate isn’t always “a great measure” of labor conditions, and there is “not any magic jobless number we are shooting for.” Ahhh, hello!? No magic jobless number? Maybe something like the 7% that was mentioned in June!?
So clearly he decided to reject the 7% target introduced just 3 months ago which is not only confusing to me but also confusing to just about everyone with an opinion on the matter. Below is a chart from Bespoke Investment Group that shows the opinions leading up to Wednesday.

Washington D.C. Circus
Washington is locked in a very public battle over funding the government. On September 30, 2013, all non-essential services will cease to be funded if there is no deal. After that, there is the battle over raising the debt ceiling sometime in mid-October. Both sides are posturing and hoping to gain an advantage in the court of public opinion. I suppose if I had to pick fighting one battle over the other, I’d pick the one that would not cause a global economic implosion to play chicken over. (If the debt ceiling were not raised, it would probably cause the U.S. to be unable to meet its financial obligations and possibly send the global markets into a panic). Hence, the silver lining is that the line has been drawn in the sand on the shut-down fight and not the debt ceiling fight.
Again, from Bespoke, the chart below shows the S&P 500 from July of 1995 to July of 1996. The red lines show the periods in that year when the government was actually shut down. This period was the last time we had a major government shut down like the one we could potentially see in the next week or so. If it happens, I hope it’s no more catastrophic to the market than the red lines below.

Please call or email with questions.
Investment advice offered through Monument Advisory Group, LLC a Registered Investment Advisor (RIA). Securities offered through LPL Financial. Member FINRA/SIPC. Monument Advisory Group and Monument Wealth Management are separate entities from LPL Financial.
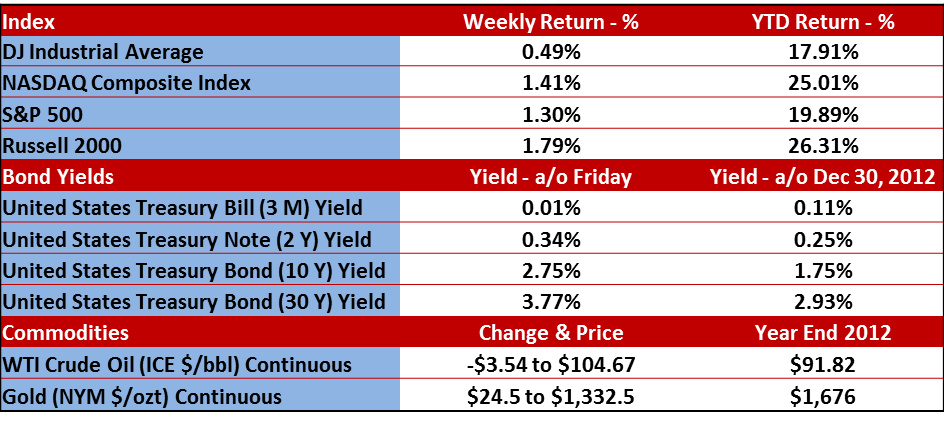
The opinions voiced in this material are for general information only and are not intended to provide specific advice or recommendations for any individual. To determine which investment(s) may be appropriate for you, consult your financial advisor prior to investing. All performance referenced is historical and is no guarantee of future results. All indices are unmanaged and cannot be invested into directly. Stock investing involves risk including loss of principal. The Dow Jones Industrial Average is comprised of 30 stocks that are major factors in their industries, and widely held by individuals and institutional investors. The Standard & Poor’s 500 Stock Index (S&P 500) is an unmanaged capitalization weighted index of 500 stocks designed to measure performance of the broad domestic economy through changes in the aggregate market value of 500 stocks representing all major industries. The NASDAQ Composite Index measures all domestic and non-U.S. based common stocks listed on The NASDAQ Stock Market. The market value, the last sale price multiplied by total shares outstanding, is calculated throughout the trading day, and is related to the total value of the Index. The Russell 2000 Small Stock Index is an unmanaged index generally representative of the 2000 smallest companies in the Russell 3000 Index. The Russell 2000 is an unmanaged index generally comprised of companies with lower price-to-book ratios and lower forecasted growth values. The 2, 10 and 30 year Treasury is simply the yield at the close of the day.
(1) West Texas Intermediate crude spot price is as of end of week.
(2) London Bullion Market Association; gold fixing pricing at 3 p.m. London time.

David B. Armstrong, CFA
President & Co-Founder
Dave got into the industry when he discovered his passion for finance in his mid-20’s. He’s a combat veteran and served as an officer in the United States Marines Corps on both active duty and in the reserves, retiring at the rank of Lieutenant Colonel. While serving on active duty, Dave was unable to spend money on deployments, so he became a self-taught investor. Along with a few bucks cash as a bouncer, his investing performance grew to be good....
IMPORTANT DISCLOSURE INFORMATION
Please remember that past performance is no guarantee of future results. Different types of investments involve varying degrees of risk, and there can be no assurance that the future performance of any specific investment, investment strategy, or product (including the investments and/or investment strategies recommended or undertaken by Monument Capital Management, LLC [“Monument”]), or any non-investment related content, made reference to directly or indirectly in this blog will be profitable, equal any corresponding indicated historical performance level(s), be suitable for your portfolio or individual situation, or prove successful. Due to various factors, including changing market conditions and/or applicable laws, the content may no longer be reflective of current opinions or positions. Moreover, you should not assume that any discussion or information contained in this blog serves as the receipt of, or as a substitute for, personalized investment advice from Monument. To the extent that a reader has any questions regarding the applicability of any specific issue discussed above to his/her individual situation, he/she is encouraged to consult with the professional advisor of his/her choosing. No amount of prior experience or success should be construed that a certain level of results or satisfaction will be achieved if Monument is engaged, or continues to be engaged, to provide investment advisory services. Monument is neither a law firm nor a certified public accounting firm and no portion of the blog content should be construed as legal or accounting advice.
A copy of Monument’s current written disclosure Brochure discussing our advisory services and fees is available for review upon request or at www.monumentwealthmanagement.com/disclosures. Please Note: Monument does not make any representations or warranties as to the accuracy, timeliness, suitability, completeness, or relevance of any information prepared by any unaffiliated third party, whether linked to Monument’s website or blog or incorporated herein, and takes no responsibility for any such content. All such information is provided solely for convenience purposes only and all users thereof should be guided accordingly.
Historical performance results for investment indices, benchmarks, and/or categories have been provided for general informational/comparison purposes only, and generally do not reflect the deduction of transaction and/or custodial charges, the deduction of an investment management fee, nor the impact of taxes, the incurrence of which would have the effect of decreasing historical performance results. It should not be assumed that your Monument account holdings correspond directly to any comparative indices or categories. Please Also Note: (1) performance results do not reflect the impact of taxes; (2) comparative benchmarks/indices may be more or less volatile than your Monument accounts; and, (3) a description of each comparative benchmark/index is available upon request.
Please Remember: If you are a Monument client, please contact Monument, in writing, if there are any changes in your personal/financial situation or investment objectives for the purpose of reviewing/evaluating/revising our previous recommendations and/or services, or if you would like to impose, add, or to modify any reasonable restrictions to our investment advisory services. Unless, and until, you notify us, in writing, to the contrary, we shall continue to provide services as we do currently. Please Also Remember to advise us if you have not been receiving account statements (at least quarterly) from the account custodian.