Our “Off The Wall” Blog
is now Monument #Unfiltered
Subscribe below to receive our unique, straight-forward, unfiltered wealth advice delivered straight to your inbox.
Market Sell-offs Warrant the the F-Bomb…and I’m Using it Again.
Well, it’s official – the S&P 500 Index is down more than 10% from its previous peak, which means it’s in correction territory…and oophf, on Friday, the S&P 500 was down around 4% and is now about 14% off its highs. Other parts of the stock market are down even more.
Yesterday there was even more red on the screen with the S&P 500 shedding around another 1.50% by 3pm.
This tweet from yesterday comes from Tesla (I mean Elon Musk).

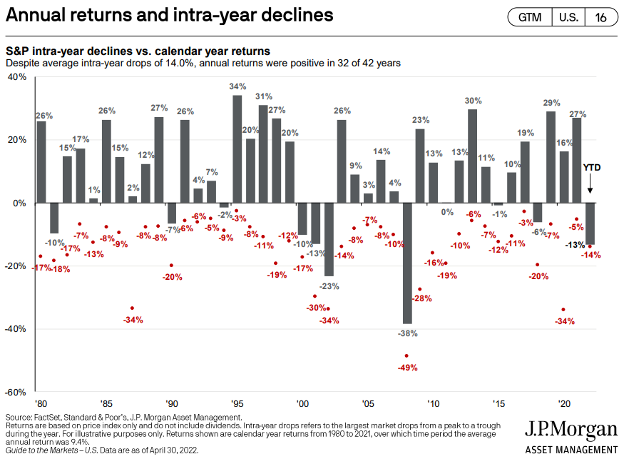
So why is this happening? The snarky answer is, “Because shit like this happens on average once a year.” Even with intra-year declines of 14%, the market has posted positive returns 32 out of the last 42 years…or 76% of the time.
I’ve written about this before because, well, this has happened before. A lot, in fact. Look at it this way… I came into the business in August of 1999. Here’s a table of how much each calendar year has been down for every year I’ve been in the biz…
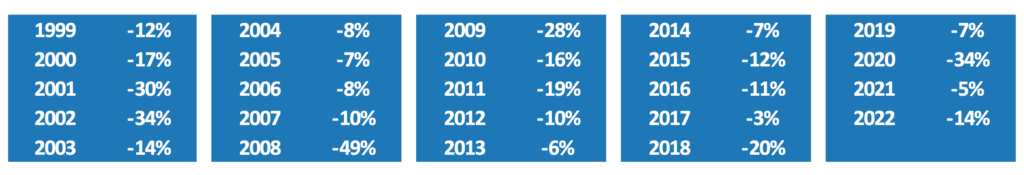
So of the 24 years (I’m gonna count 1999), ten years (42%) had intra-year declines of greater than the 14% average, 12 (50%) were less than the average, and two years (8%) were exactly 14% drops.
Since we use a drop of 10% to define a “correction”, 16 of my 24 years (67%) have had a 10% or greater loss.
I’m not bragging, I’m just saying that my experience informs me because another way of looking at this is from the percentage of years that had drops AND finished the year in the red: 2000, 2001, 2002, 2008, 2015 (with 2011 at 0% and the 2015 drop at -1%). That’s 5 out of 24 years (20%), and one of those five years was a -1% loss, so you could argue it could also be 16% rather than 20%.
Back to what I AM trying to say. Shit happens, and sometimes there is a reason, and sometimes there’s not, and sometimes there are reasons and they aren’t the reasons you think and sometimes the reasons are exactly what you think. Regardless, those reasons are not predictable and therefore are impossible to anticipate.
Except…are they? Are they impossible to anticipate?
In fact, they are.
You can’t anticipate THE pullback, THE correction, THE bear market, or THE market rout…but you can anticipate A pullback, A correction, A bear market, or A market rout.
If you build your wealth plan to raise and hold the cash you need when the market is at all-time highs, you essentially become financially unbreakable.
BAD LANGUAGE ALERT…but follow me, because while I’m generally loose with the language, I’m purposefully using it here.
First – understand this next part is attributed to John Goodman, who distributed some of the most usable financial advice to come out of Hollywood. The one-minute YouTube clip is here. If you don’t know the scene (or watch it first) you won’t understand the below. So check it…

Now – what does it mean to be financially unbreakable? Well, in my words, it’s the ability to look at a market pullback, glance over at your cash balance, then back to the market and say, “Fuck you.” The market is down 15%, “Fuck you.” The market is down 25%, “Fuck you.”
I can keep going, but you get the point. And crass, yeah I get that too, but hey, I got you to read it…so there’s that.
How much cash is the right amount to be financially unbreakable? You need a plan to be sure, but you can take a SWAG at it by using 12-15 months. Frankly, even 3 or 6 months gives you a degree of “unbreakability.”
I know I’m a broken record on the cash, but I come back to the 24 years and all the stats. The losses become permanent when you need to raise cash inside a window of a downturn. If you can live out of a pot of cash and not sell the securities when they are down, you avoid permanent losses.
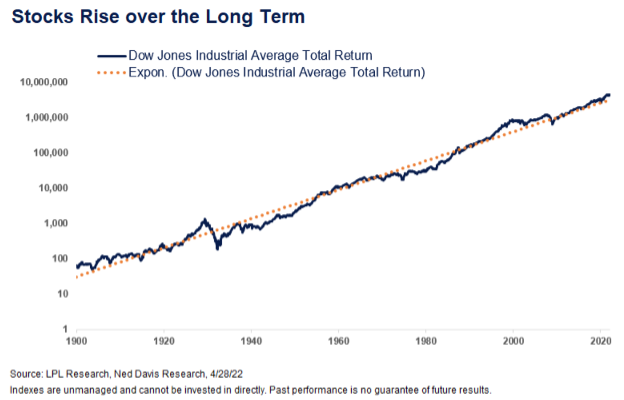
Short-term volatility doesn’t change the fact that time is on your side if you exercise patience and don’t fall victim to your caveman brain’s survival instincts kicking in.
The annualized return over the period of the below chart is 9.5%. If you are financially unbreakable and can endure the short-term pain of these corrections, your returns should look similar.
I know sell-offs are brutal and when I take the stage with “be patient, stick to the plan, don’t panic, hold on, don’t sell, have cash, be unbreakable, etc,” it can come off as cavalier or dismissive. I promise it’s not – the whole Team knows that times like this create anxiety and stir emotions which generate natural and understandable survival instincts.
If you are worried and need to talk, please reach out. We are all here to help.
Also, remember…
Keep looking forward.


David B. Armstrong, CFA
President & Co-Founder
Dave got into the industry when he discovered his passion for finance in his mid-20’s. He’s a combat veteran and served as an officer in the United States Marines Corps on both active duty and in the reserves, retiring at the rank of Lieutenant Colonel. While serving on active duty, Dave was unable to spend money on deployments, so he became a self-taught investor. Along with a few bucks cash as a bouncer, his investing performance grew to be good....
Recent Posts
By David B. Armstrong, CFA
IMPORTANT DISCLOSURE INFORMATION
Please remember that past performance is no guarantee of future results. Different types of investments involve varying degrees of risk, and there can be no assurance that the future performance of any specific investment, investment strategy, or product (including the investments and/or investment strategies recommended or undertaken by Monument Capital Management, LLC [“Monument”]), or any non-investment related content, made reference to directly or indirectly in this blog will be profitable, equal any corresponding indicated historical performance level(s), be suitable for your portfolio or individual situation, or prove successful. Due to various factors, including changing market conditions and/or applicable laws, the content may no longer be reflective of current opinions or positions. Moreover, you should not assume that any discussion or information contained in this blog serves as the receipt of, or as a substitute for, personalized investment advice from Monument. To the extent that a reader has any questions regarding the applicability of any specific issue discussed above to his/her individual situation, he/she is encouraged to consult with the professional advisor of his/her choosing. No amount of prior experience or success should be construed that a certain level of results or satisfaction will be achieved if Monument is engaged, or continues to be engaged, to provide investment advisory services. Monument is neither a law firm nor a certified public accounting firm and no portion of the blog content should be construed as legal or accounting advice.
A copy of Monument’s current written disclosure Brochure discussing our advisory services and fees is available for review upon request or at www.monumentwealthmanagement.com/disclosures. Please Note: Monument does not make any representations or warranties as to the accuracy, timeliness, suitability, completeness, or relevance of any information prepared by any unaffiliated third party, whether linked to Monument’s website or blog or incorporated herein, and takes no responsibility for any such content. All such information is provided solely for convenience purposes only and all users thereof should be guided accordingly.
Historical performance results for investment indices, benchmarks, and/or categories have been provided for general informational/comparison purposes only, and generally do not reflect the deduction of transaction and/or custodial charges, the deduction of an investment management fee, nor the impact of taxes, the incurrence of which would have the effect of decreasing historical performance results. It should not be assumed that your Monument account holdings correspond directly to any comparative indices or categories. Please Also Note: (1) performance results do not reflect the impact of taxes; (2) comparative benchmarks/indices may be more or less volatile than your Monument accounts; and, (3) a description of each comparative benchmark/index is available upon request.
Please Remember: If you are a Monument client, please contact Monument, in writing, if there are any changes in your personal/financial situation or investment objectives for the purpose of reviewing/evaluating/revising our previous recommendations and/or services, or if you would like to impose, add, or to modify any reasonable restrictions to our investment advisory services. Unless, and until, you notify us, in writing, to the contrary, we shall continue to provide services as we do currently. Please Also Remember to advise us if you have not been receiving account statements (at least quarterly) from the account custodian.