Our “Off The Wall” Blog
is now Monument #Unfiltered
Subscribe below to receive our unique, straight-forward, unfiltered wealth advice delivered straight to your inbox.
Is the Market Too High to Buy?

Sounds like a good title for a stoner movie…
Anyway – Here’s a quote from the weekend Bespoke report:
The S&P 500 made its 24th all-time closing high on Monday, but after three straight down days through Thursday, stopped there. Overall, though, the trend higher continues. The bull market remains innocent until proven guilty, and until that changes it’s hard to justify taking anything other than a positive view towards the market. As we will detail later in the report, it may not be as innocent as it was during prior legs higher, but the internals are far from collapsing.
They then presented this chart, below.
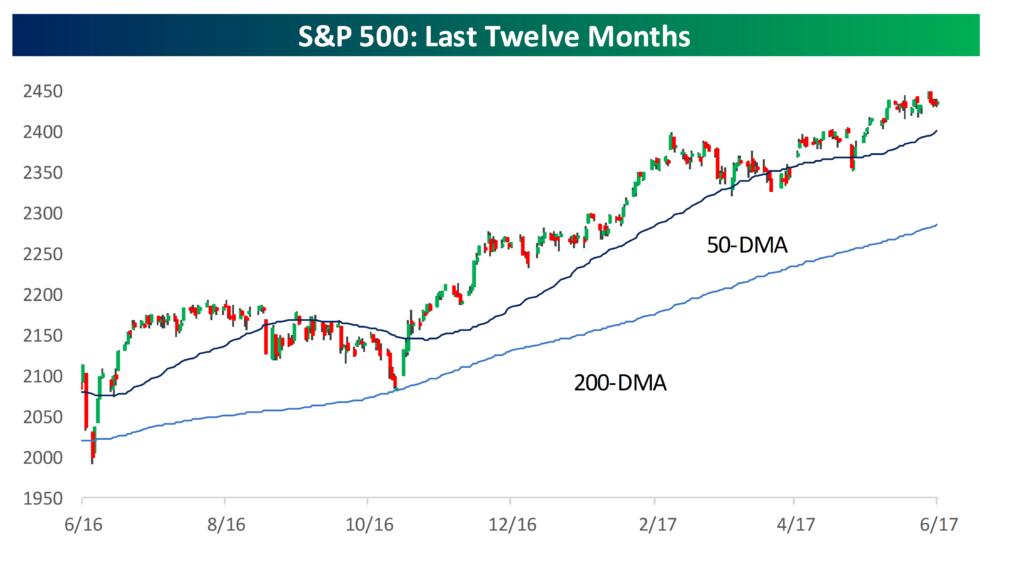
2017 has been a good year. So far, the biggest peak to trough drop was around -2.8% over a 32-day period (March-April window).
I’m not saying it’s a screaming “buy” but I’m also not pounding the table that no one should be exercising a systematic buy program. If you put long-term cash to work now, you may not be overwhelmed with returns over the next year. But if you look back on today 10 years from now, I’ll bet you’d be happy.
Not a recommendation either way…I’m just sayin’. (That’s my compliance disclosure and CYA.)
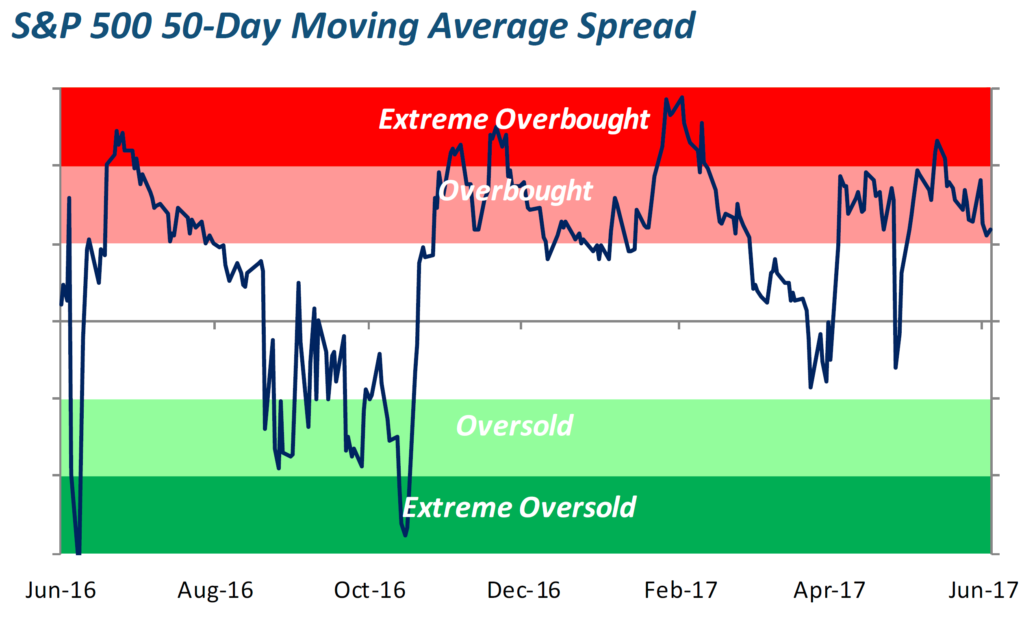
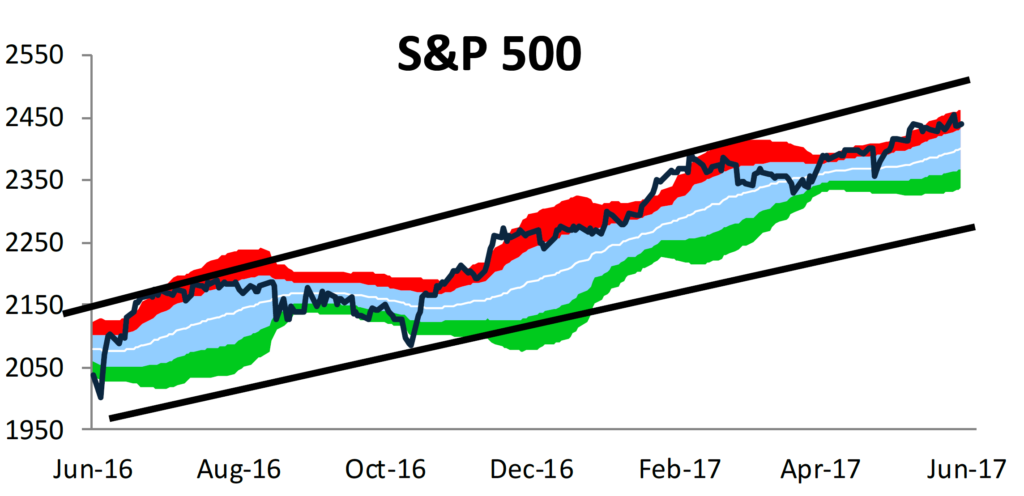
The charts below are from Bespoke.
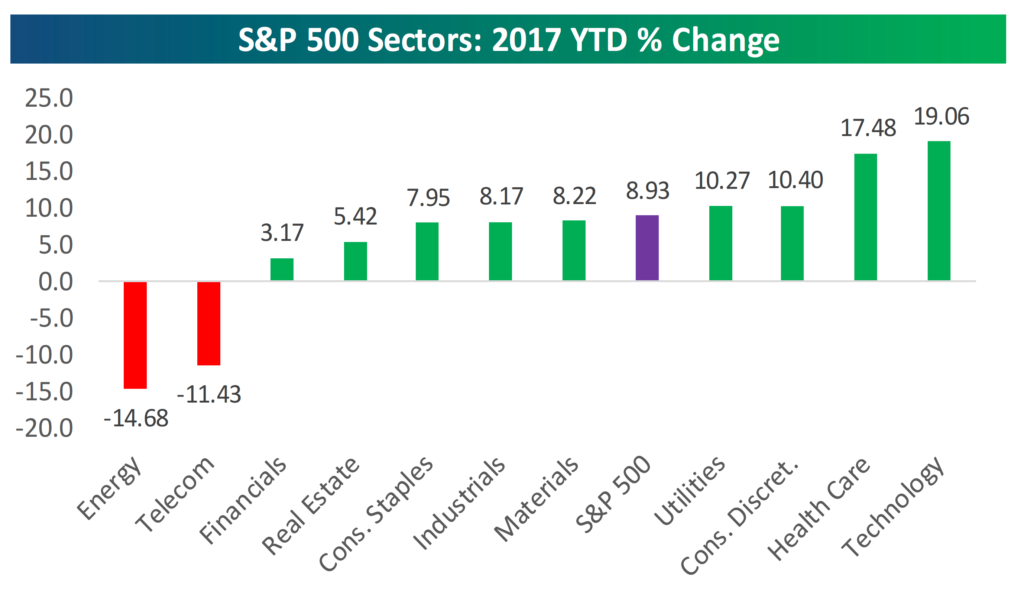
Got Milk?
Or at least an abundance of Tech and Health Care? If not, you are probably in line with the market for the calendar year. (Chart: Bespoke)
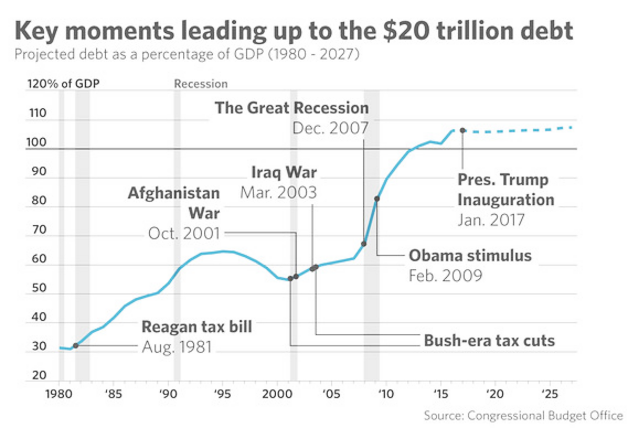
How We Got Here
There’s no real commentary here other than…wow. At first blush this will look like a lot of spending, but because it’s a percentage of GDP, the 8-9 years of sluggish economy have been fuel of this fire, too. We really need to get the economy going for this to dip back down like the 90s.
The Yield Curve and Recession
You are going to start reading more and more about the yield curve flattening. The yield curve measures the difference between short term interest rates and longer term interest rates. It is generally defined as the difference between the 2-year Treasury and the 10-year Treasury.
When it is steep, it means that the interest rates you pay for longer term loans is higher than for shorter term loans. It’s a signal that investors, lenders and borrowers all think the economy will be growing more quickly in the future. When it flattens due to market forces it’s because those same people expect the economy to suck or get suck-ier in the future.
Right now, it’s positive 80 basis points. This means the 10-year is 8/10ths of a percentage point HIGHER than the 2-year.
Inverted means that the 2-year Treasury will have a higher interest rate than the 10-year and it is a near perfect predictor of a recession. PROBLEM – it does not signal WHEN the recession will begin.
It’s worth watching and believe me it will be on the news if it keeps flattening…you think news coverage of “Flippin’ the 6th” for the special election in Georgia was all over the news… wait until the yield curve inverts.
But remember, the path of the curve is not a predictor of inversion. I think the thing that’s most important about the curve is that it makes it really hard for the Fed to keep raising rates or THEY will invert it rather than the market.
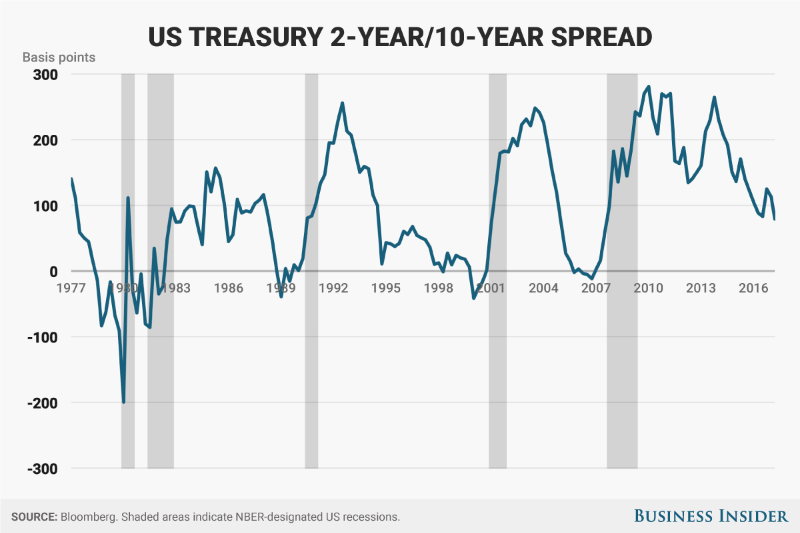
For example, look at the period between the 1991 recession and the one around 2001…yield curves can be flat or flattening for a very long time while the stock market continues to do well. In fact, the current spread is wider now than for most of the 90s.
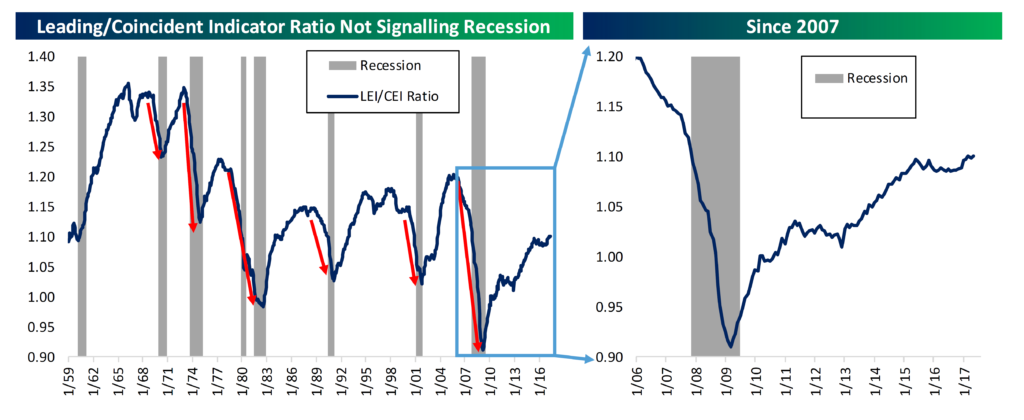
My point is to be aware, but don’t get sucked into a fear cycle. This chart is helpful to see that Leading Economic Indicators and Coincident Economic Indicators are not signaling recession. (Charts: Bespoke)
Give us a call with any questions.

Important Disclosure Information
Please remember that past performance may not be indicative of future results. Different types of investments involve varying degrees of risk, and there can be no assurance that the future performance of any specific investment, investment strategy, or product (including the investments and/or investment strategies recommended or undertaken by Monument Wealth Management), or any non-investment related content, made reference to directly or indirectly in this blog will be profitable, equal any corresponding indicated historical performance level(s), be suitable for your portfolio or individual situation, or prove successful. All indexes referenced are unmanaged and cannot be invested into directly. The economic forecasts set forth may not develop as predicted. Due to various factors, including changing market conditions and/or applicable laws, the content may no longer be reflective of current opinions or positions. Moreover, you should not assume that any discussion or information contained in this blog serves as the receipt of, or as a substitute for, personalized investment advice from Monument Wealth Management. To the extent that a reader has any questions regarding the applicability of any specific issue discussed above to his/her individual situation, he/she is encouraged to consult with the professional advisor of his/her choosing. Monument Wealth Management is neither a law firm nor a certified public accounting firm and no portion of the blog content should be construed as legal or accounting advice. A copy of Monument Wealth Management’s current written disclosure statement discussing our advisory services and fees is available for review upon request.

David B. Armstrong, CFA
President & Co-Founder
Dave got into the industry when he discovered his passion for finance in his mid-20’s. He’s a combat veteran and served as an officer in the United States Marines Corps on both active duty and in the reserves, retiring at the rank of Lieutenant Colonel. While serving on active duty, Dave was unable to spend money on deployments, so he became a self-taught investor. Along with a few bucks cash as a bouncer, his investing performance grew to be good....
IMPORTANT DISCLOSURE INFORMATION
Please remember that past performance is no guarantee of future results. Different types of investments involve varying degrees of risk, and there can be no assurance that the future performance of any specific investment, investment strategy, or product (including the investments and/or investment strategies recommended or undertaken by Monument Capital Management, LLC [“Monument”]), or any non-investment related content, made reference to directly or indirectly in this blog will be profitable, equal any corresponding indicated historical performance level(s), be suitable for your portfolio or individual situation, or prove successful. Due to various factors, including changing market conditions and/or applicable laws, the content may no longer be reflective of current opinions or positions. Moreover, you should not assume that any discussion or information contained in this blog serves as the receipt of, or as a substitute for, personalized investment advice from Monument. To the extent that a reader has any questions regarding the applicability of any specific issue discussed above to his/her individual situation, he/she is encouraged to consult with the professional advisor of his/her choosing. No amount of prior experience or success should be construed that a certain level of results or satisfaction will be achieved if Monument is engaged, or continues to be engaged, to provide investment advisory services. Monument is neither a law firm nor a certified public accounting firm and no portion of the blog content should be construed as legal or accounting advice.
A copy of Monument’s current written disclosure Brochure discussing our advisory services and fees is available for review upon request or at www.monumentwealthmanagement.com/disclosures. Please Note: Monument does not make any representations or warranties as to the accuracy, timeliness, suitability, completeness, or relevance of any information prepared by any unaffiliated third party, whether linked to Monument’s website or blog or incorporated herein, and takes no responsibility for any such content. All such information is provided solely for convenience purposes only and all users thereof should be guided accordingly.
Historical performance results for investment indices, benchmarks, and/or categories have been provided for general informational/comparison purposes only, and generally do not reflect the deduction of transaction and/or custodial charges, the deduction of an investment management fee, nor the impact of taxes, the incurrence of which would have the effect of decreasing historical performance results. It should not be assumed that your Monument account holdings correspond directly to any comparative indices or categories. Please Also Note: (1) performance results do not reflect the impact of taxes; (2) comparative benchmarks/indices may be more or less volatile than your Monument accounts; and, (3) a description of each comparative benchmark/index is available upon request.
Please Remember: If you are a Monument client, please contact Monument, in writing, if there are any changes in your personal/financial situation or investment objectives for the purpose of reviewing/evaluating/revising our previous recommendations and/or services, or if you would like to impose, add, or to modify any reasonable restrictions to our investment advisory services. Unless, and until, you notify us, in writing, to the contrary, we shall continue to provide services as we do currently. Please Also Remember to advise us if you have not been receiving account statements (at least quarterly) from the account custodian.