Our “Off The Wall” Blog
is now Monument #Unfiltered
Subscribe below to receive our unique, straight-forward, unfiltered wealth advice delivered straight to your inbox.
March Madness and the Stock Market

Great – March Madness is here. The annual 64-game NCAA basketball tournament kicks off this week and as a business owner I can assure you I’m losing money on productivity. In fact, since it’s just not worth fighting, we started our own bracket for charity. If you’d like to participate, email us and we’ll sign you up. 1st, 2nd and 3rd place winners get $500, $250, $100 to the charity of their choice.
March Madness and the Stock Market
This is a great time of the year to remind investors about investment decisions by relating them back to how a lot of folks pick their teams in the tournament. Dorsey Wright always does a great job with updating the statistics every year on the seeding of teams in the tournament and how well they do. As most people know, there are 64 teams broken down into 4 regions (groups) of 16 teams. Within each of the 4 regions, teams are seeded (ranked) 1 through 16.
There are some interesting statistics about the probability of success associated with the seeds.
For example, let’s look at the games where the number 16 seed plays the number 1 seed. The number 16 seed has NEVER beaten a number 1 seed team. (since 1979). So we can all agree that picking the number 16 team is probably a bad bet. Also, the teams seeded number 13, 14, 15 and 16 only win 10% of their games combined. Again, the 13 through 16 seeded teams do not have a high probability of winning. The top 3 seeded teams combine to win 73% of their games. Those are good odds. Finally, the tournament winner has come from a team seeded in the top 4 in 26 out of past 28 years.
But most people will spend time trying to identify the upset, the ‘bracket buster,’ that will come in the early part of the tournament rather than honing in on the higher seeded teams who have the best chance of making it to the Final Four. There is just a certain amount of fun and bragging about picking the long-shot.
As if it has anything to do with skill.
Just like with investing. A general rule of thumb which is commonly accepted in both academia and amongst practitioners is that 80% of the return in a portfolio comes from the return of the overall market and sectors, while 20% comes from stock picking. (Benjamin F. King published research to this effect in 1966 called “Market and Industrial Factors in Stock Price Behaviors. The report is more complicated than my previous sentence, but that’s the essence of it).
So just like brackets, a lot of investors spend a lot of time trying to pick the ‘outlier’ stock that has a low probability of outperforming rather than picking sectors of the market that have a higher probability of success. There is a whole chapter dedicated in this book to how we specifically implement this strategy at Monument Wealth Management. (We receive no royalties or anything else for that matter).
So in my brackets I’ll be looking for the busters, because that’s part of the fun, even though it lowers my probability of winning. However when it comes to investing, I’m recommending the opposite.
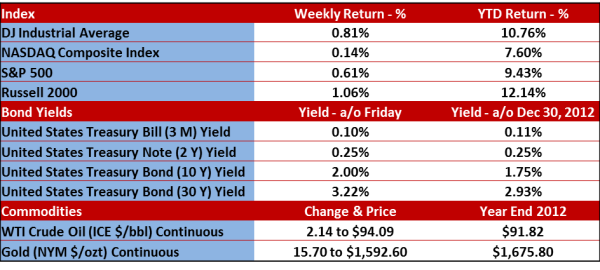
Let’s quickly review the markets from last week.
It should be no surprise that the Down Jones Industrial Average (DJIA) is trading at an all-time high and went on a 10 day winning streak that had not been seen since 1996. It was not until Friday that the streak came to an end with a 25 point down day.
Even more impressive (my opinion) is the fact that the DJIA has lost ground in only two of the eleven weeks since the year began, and those losses amounted to a meager -0.2%. The broader-based Standard & Poor’s 500 (S&P 500) index closed on Thursday within 2 points of its all-time closing high of 1,565.15 set in October 2007.
Here’s how the week ended up across the board.
Enjoy the week – it’s as fun as it is unproductive. Call with questions.
IMPORTANT NOTE: Due to industry regulations, comments are not permitted on this blog. If you would like to contact the author, please email us at info@monumentwm.com.
Securities and Financial Planning offered through LPL Financial, a Registered Investment Advisor. Member FINRA/SIPC
The opinions voiced in this material are for general information only and are not intended to provide specific advice or recommendations for any individual. To determine which investment(s) may be appropriate for you, consult your financial advisor prior to investing. All performance referenced is historical and is no guarantee of future results. All indices are unmanaged and cannot be invested into directly. Stock investing involves risk including loss of principal. The Dow Jones Industrial Average is comprised of 30 stocks that are major factors in their industries, and widely held by individuals and institutional investors. The Standard & Poor’s 500 Stock Index (S&P 500) is an unmanaged capitalization weighted index of 500 stocks designed to measure performance of the broad domestic economy through changes in the aggregate market value of 500 stocks representing all major industries. The NASDAQ Composite Index measures all domestic and non-U.S. based common stocks listed on The NASDAQ Stock Market. The market value, the last sale price multiplied by total shares outstanding, is calculated throughout the trading day, and is related to the total value of the Index. The Russell 2000 Small Stock Index is an unmanaged index generally representative of the 2000 smallest companies in the Russell 3000 Index. The Russell 2000 is an unmanaged index generally comprised of companies with lower price-to-book ratios and lower forecasted growth values. The 2, 10 and 30 year Treasury is simply the yield at the close of the day.
(1) West Texas Intermediate crude spot price is as of end of week.
(2) London Bullion Market Association; gold fixing pricing at 3 p.m. London time.

David B. Armstrong, CFA
President & Co-Founder
Dave got into the industry when he discovered his passion for finance in his mid-20’s. He’s a combat veteran and served as an officer in the United States Marines Corps on both active duty and in the reserves, retiring at the rank of Lieutenant Colonel. While serving on active duty, Dave was unable to spend money on deployments, so he became a self-taught investor. Along with a few bucks cash as a bouncer, his investing performance grew to be good....
IMPORTANT DISCLOSURE INFORMATION
Please remember that past performance is no guarantee of future results. Different types of investments involve varying degrees of risk, and there can be no assurance that the future performance of any specific investment, investment strategy, or product (including the investments and/or investment strategies recommended or undertaken by Monument Capital Management, LLC [“Monument”]), or any non-investment related content, made reference to directly or indirectly in this blog will be profitable, equal any corresponding indicated historical performance level(s), be suitable for your portfolio or individual situation, or prove successful. Due to various factors, including changing market conditions and/or applicable laws, the content may no longer be reflective of current opinions or positions. Moreover, you should not assume that any discussion or information contained in this blog serves as the receipt of, or as a substitute for, personalized investment advice from Monument. To the extent that a reader has any questions regarding the applicability of any specific issue discussed above to his/her individual situation, he/she is encouraged to consult with the professional advisor of his/her choosing. No amount of prior experience or success should be construed that a certain level of results or satisfaction will be achieved if Monument is engaged, or continues to be engaged, to provide investment advisory services. Monument is neither a law firm nor a certified public accounting firm and no portion of the blog content should be construed as legal or accounting advice.
A copy of Monument’s current written disclosure Brochure discussing our advisory services and fees is available for review upon request or at www.monumentwealthmanagement.com/disclosures. Please Note: Monument does not make any representations or warranties as to the accuracy, timeliness, suitability, completeness, or relevance of any information prepared by any unaffiliated third party, whether linked to Monument’s website or blog or incorporated herein, and takes no responsibility for any such content. All such information is provided solely for convenience purposes only and all users thereof should be guided accordingly.
Historical performance results for investment indices, benchmarks, and/or categories have been provided for general informational/comparison purposes only, and generally do not reflect the deduction of transaction and/or custodial charges, the deduction of an investment management fee, nor the impact of taxes, the incurrence of which would have the effect of decreasing historical performance results. It should not be assumed that your Monument account holdings correspond directly to any comparative indices or categories. Please Also Note: (1) performance results do not reflect the impact of taxes; (2) comparative benchmarks/indices may be more or less volatile than your Monument accounts; and, (3) a description of each comparative benchmark/index is available upon request.
Please Remember: If you are a Monument client, please contact Monument, in writing, if there are any changes in your personal/financial situation or investment objectives for the purpose of reviewing/evaluating/revising our previous recommendations and/or services, or if you would like to impose, add, or to modify any reasonable restrictions to our investment advisory services. Unless, and until, you notify us, in writing, to the contrary, we shall continue to provide services as we do currently. Please Also Remember to advise us if you have not been receiving account statements (at least quarterly) from the account custodian.