Explore Our
“Off The Wall” Blog

Unique, straight-forward, unfiltered opinion on topics of concern for individuals with newfound wealth.

Is Your Portfolio Over-Allocated to Tech? Why it Matters.

If you are underweight in the most volatile sector of the S&P 500, you probably aren’t pumped about your YTD performance – here’s why.

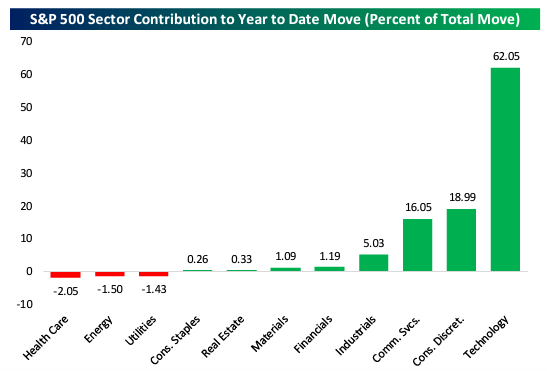
While 8 of the 11 sectors in the S&P 500 were positive contributors to the overall return in the S&P 500 for the first six months of 2023, the real thank you needs to be given to the tech sector.

In case you were unaware, the Tech sector accounted for 62% of the gains in the S&P 500 for the first six months of 2023.

That is more than triple the contribution of the next biggest contributing sector, Consumer Discretionary, which accounted for 19% of the first-half returns.

After that, Communication Services came in at 16%, but I think that is a fraternal twin of Tech.

From there, we dipped down into single-digit positive percentage contributions from Industrials, Financials, Materials, Real Estate, and Consumer Staples.

The three negatives contributing sectors were Utilities, Energy, and Healthcare at -1.4%, -1.5%, and -2%, respectively. So, while there were three laggards, they weren’t significant regarding negative percentage contribution.

See the chart below from Bespoke Investment Group:

S&P 500 Sector Contribution YTD Move


The Tech Sector’s Role in Portfolio Returns

But back to the Tech sector. This year, the Tech sector’s contribution was a function of two different things.

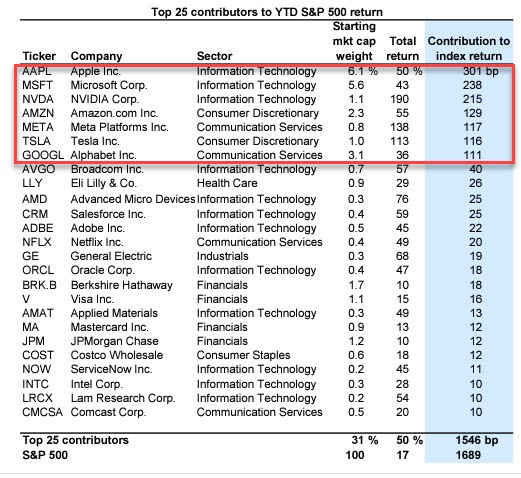
The first is the tech sector’s massive outperformance from a return perspective. The chart below shows the weighted return of contribution from the top contributors (Security Return * S&P 500 Weighting. Chart: Goldman Sachs).

Top 10 Contributors to S&P 500 return


Remember those top five names. I’ll use them again in two charts below.

Now, the second is Tech’s outsized weighting as a share of the total S&P 500 market cap relative to all other sectors.

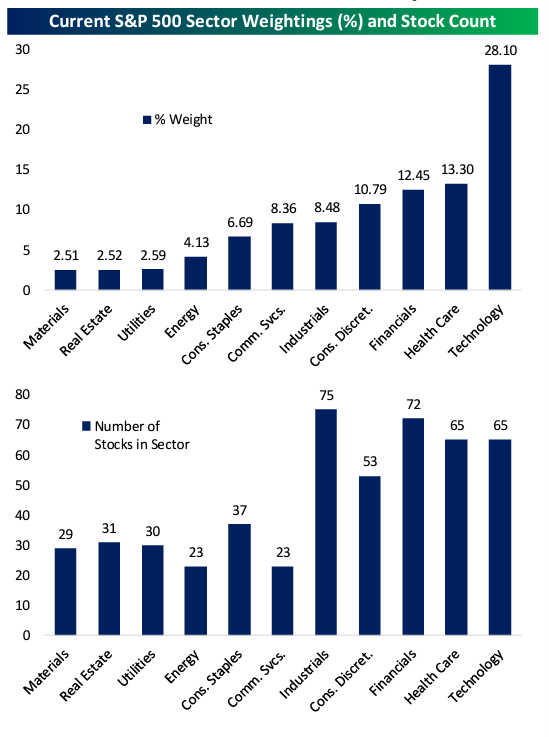
Below is a chart (again from Bespoke Investment Group) showing each of the 11 sectors’ percentage weighting inside the S&P 500 index. As you can see, Tech is by far the largest sector and accounts for well over 25% of the total S&P 500 index weighing in at 28.1%. Compare that to the next largest sector, Healthcare, at 13.3%.

That’s not even half the size of the Tech sector by market cap.

What is also important to realize about the Tech sector is that it carries the largest weighting and is one of the larger sectors by number of individual stocks.

Technology and Healthcare have 65 stocks in their sector and are only outgunned by Financials at 72 stocks and Industrials at 75 stocks.

S&P 500 Sector Weightings and Stock Count

Interestingly, while Industrials carry the highest number of individual securities of any of the 11 sectors, it came in the middle of the pack in terms of index weighting at 8.48%.

While the Tech sector weighting of 28% may seem high, it is worth noting it peaked during the 2000.com bubble at 35%. (That’s not in the chart; I just looked it up.)

The last point I will make about the data is that for all of the volatility inside of the banking sector in the first half of 2023, Financials did contribute positively to the overall first-half return in the S&P 500. I point this out only because I am always reiterating that the news and the market aren’t always necessarily telling you the same thing.

What this means to you

If you are looking at a well-diversified portfolio and comparing it against the S&P 500, you may be scratching your head and wondering why your performance is not in line with the first half returns of the S&P 500.

If you are in line with the S&P 500, I will refer you back to the above and remind you that while the S&P 500 holds roughly 500 different securities, you are really not significantly invested outside of the top ten holdings inside that index.

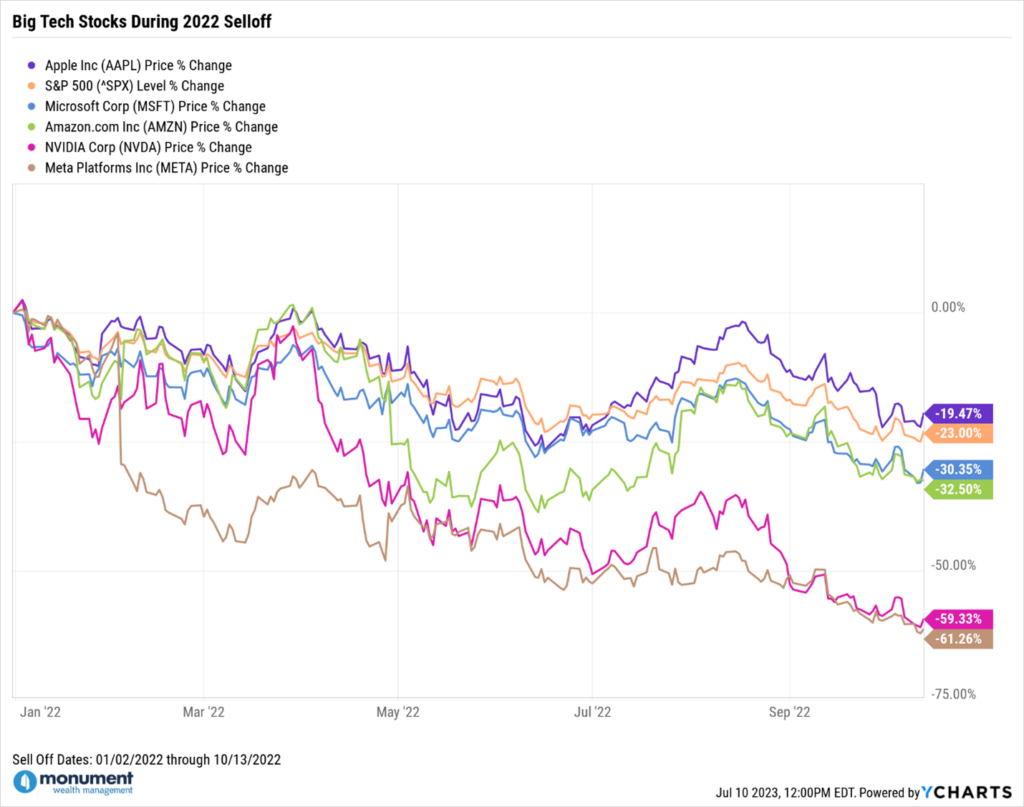
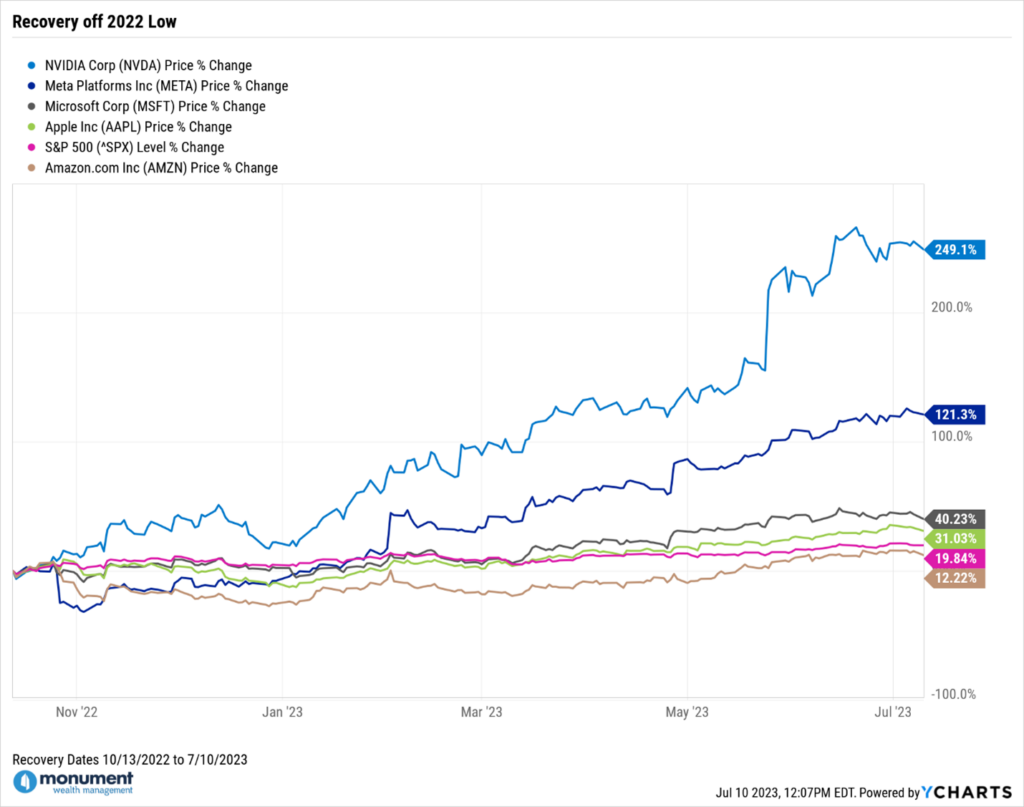
For those of you who fall into the latter bucket, I know it feels good right now, but it’s imperative to remember back to the later stages of 2022 when the tech sector was feeling a lot more heat than the other sectors. Here it is visually in two charts – the “Big Tech Stocks During 2022 Sell Off” and then the “Recovery off 2022 Low.”


Big Tech Stocks During 2022 Selloff

Recovery of 2022 Low

I am not preaching; I’m just pointing out that most people feel really good when their portfolios are going up and feel twice as bad when their portfolios are going down.

If you are over-allocated to Tech, please remember that point.

I will constantly preach about my absolute conviction that a well-diversified equity portfolio will always perform very well over a long period, which is what all investors should be looking at.

Finally, this is a great time to raise cash if you have been living out of your cash bucket for the past 12 months. While the market has not recovered fully to its previous all-time high, it has recovered enough for you to feel good about refilling your cash bucket.

The only downside to refilling your cash bucket now is the opportunity cost of possible future growth over the next 6 to 12 months. Conservative investors should be more concerned about having a full cash bucket than the opportunity cost of those returns.

Please reach out if you have any questions. Giving people unfiltered opinions and straightforward advice is our value proposition.

Keep looking forward,

DBA Signature

David B. photo

David B. Armstrong, CFA

President & Co-Founder

Dave got into the industry when he discovered his passion for finance in his mid-20’s. He’s a combat veteran and served as an officer in the United States Marines Corps on both active duty and in the reserves, retiring at the rank of Lieutenant Colonel. While serving on active duty, Dave was unable to spend money on deployments, so he became a self-taught investor. Along with a few bucks cash as a bouncer, his investing performance grew to be good....

Learn more ...

IMPORTANT DISCLOSURE INFORMATION

Please remember that past performance is no guarantee of future results.  Different types of investments involve varying degrees of risk, and there can be no assurance that the future performance of any specific investment, investment strategy, or product (including the investments and/or investment strategies recommended or undertaken by Monument Capital Management, LLC [“Monument”]), or any non-investment related content, made reference to directly or indirectly in this blog will be profitable, equal any corresponding indicated historical performance level(s), be suitable for your portfolio or individual situation, or prove successful.  Due to various factors, including changing market conditions and/or applicable laws, the content may no longer be reflective of current opinions or positions.  Moreover, you should not assume that any discussion or information contained in this blog serves as the receipt of, or as a substitute for, personalized investment advice from Monument. To the extent that a reader has any questions regarding the applicability of any specific issue discussed above to his/her individual situation, he/she is encouraged to consult with the professional advisor of his/her choosing. No amount of prior experience or success should be construed that a certain level of results or satisfaction will be achieved if Monument is engaged, or continues to be engaged, to provide investment advisory services. Monument is neither a law firm nor a certified public accounting firm and no portion of the blog content should be construed as legal or accounting advice.

A copy of the Monument’s current written disclosure Brochure discussing our advisory services and fees is available for review upon request or at www.monumentwealthmanagement.com/disclosures. Please Note: Monument does not make any representations or warranties as to the accuracy, timeliness, suitability, completeness, or relevance of any information prepared by any unaffiliated third party, whether linked to Monument’s website or blog or incorporated herein, and takes no responsibility for any such content. All such information is provided solely for convenience purposes only and all users thereof should be guided accordingly.

Historical performance results for investment indices, benchmarks, and/or categories have been provided for general informational/comparison purposes only, and generally do not reflect the deduction of transaction and/or custodial charges, the deduction of an investment management fee, nor the impact of taxes, the incurrence of which would have the effect of decreasing historical performance results.  It should not be assumed that your Monument account holdings correspond directly to any comparative indices or categories. Please Also Note: (1) performance results do not reflect the impact of taxes; (2) comparative benchmarks/indices may be more or less volatile than your Monument accounts; and, (3) a description of each comparative benchmark/index is available upon request.

Please Remember: If you are a Monument client, please contact Monument, in writing, if there are any changes in your personal/financial situation or investment objectives for the purpose of reviewing/evaluating/revising our previous recommendations and/or services, or if you would like to impose, add, or to modify any reasonable restrictions to our investment advisory services.  Unless, and until, you notify us, in writing, to the contrary, we shall continue to provide services as we do currently. Please Also Remember to advise us if you have not been receiving account statements (at least quarterly) from the account custodian.
Get Monument #Unfiltered: Our Private Wealth Newsletter

Straightforward, no B.S. wealth advice no more than 2x per month. Tuned specifically for busy, high-net-worth business professionals and investors.