Our “Off The Wall” Blog
is now Monument #Unfiltered
Subscribe below to receive our unique, straight-forward, unfiltered wealth advice delivered straight to your inbox.
Inflation Opinion
At this point, everyone is familiar with the increase in the Consumer Price Index (CPI) and the fact that it is the highest it has been in 39 years. The news is full of all the high-level facts, but I wanted to take a different perspective and dig into it a little bit to provide some thoughts that you may not be reading or hearing about in the news.
But first, have you listened to our new podcast? Check out the latest of 13 episodes where Jessica Gibbs and I host Erin Hay and Rohit Punyani in a discussion that delves into our Monument Flexible Asset Allocation portfolio strategy. It’s a great listen for anyone who likes to learn about the nuts and bolts of portfolio management.
Let’s address all of the talking about the word “transitory”. Since everyone is discussing whether or not the current inflation is transitory or here to stay, let’s start with a quick recap of a recent Senate hearing between senator Toomey from Pennsylvania and the Fed chairman.
Sen. Toomey (R-Pa): “Now, I know you believe this is transitory, but everything’s transitory. Life is transitory. How long does inflation have to run above your target before the Fed decides maybe it’s not so transitory?”
Fed Chair Jerome Powell: “Well, I think it’s, it’s probably a good time to retire that word and try to explain more clearly what we mean.”
Personally, I think this back and forth was nothing more than Chairman Powell telling senators what they want to hear because I’m not so sure I believe this increase in inflation is not transitory.
I’m not an expert—that’s just what I’m thinking.
Here’s why.
It seems to me that a few individual categories explain a lot of the 6.81% year-over-year reported inflation – specifically motor fuels, new and used cars, and rents.
So are we really looking at INFLATION if just three categories out of hundreds explain almost the whole thing?
Here’s a way to look at this…if the 6.81% year-over-year report is compared to the Fed’s 2.5% target rate for inflation, there is a 4.31% spread between reality and the target. So what’s adding to that spread?
- Motor Fuel is the largest component of the 4.31% coming in at 1.61%, then;
- New & Used Cars is 1.38%, and finally;
- Rent at 1.28%…
Add that up and you get (drum roll) 4.27%.
4.31% minus 4.27% is 4 basis points. Basically NOTHING. From this perspective, the whole difference between the Fed target and the actual 6.81% is made up of those three categories.
Before I dive into that, let’s come back to the word “transitory.” For context, the definition is below:
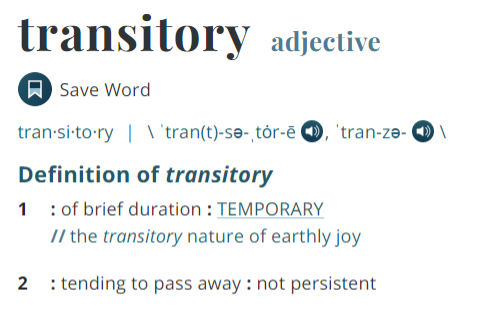
Ok, now be George Costanza for a minute and do everything opposite…what would it mean for inflation to be the opposite of transitory?
For that, imagine out to November 2022…CPI would report a year-over-year change of 6.81%, just like November 2021. That would be persistent inflation…the opposite of transitory.
But for that to happen, price categories in the CPI basket would have to do again in 2022 what they did in 2021.
Motor Fuels
Let’s consider the largest single contributing category to the 6.81% increase – motor fuels at 1.61%. Clearly, motor fuel is driven by the price of oil, which has roughly doubled from the $40s up to the $80s year-over-year. For inflation not to be transitory, oil would have to double again. It would have to go from roughly $80 to $160.
That’s not impossible. But in the world of probable vs. possible, what’s your gut tell you…you wanna bet on that?
Rents
The other category is rents, which is the largest single category weighting in calculating CPI at 32%. Rents closely follow home prices, which have skyrocketed since the pandemic, and the thing is, rents follow home prices with a lag.
So while that likely means rental prices will continue to rise over the coming year and contribute more to inflation in the coming year than in the last year, lets take a closer look at what that would actually MEAN for inflation.
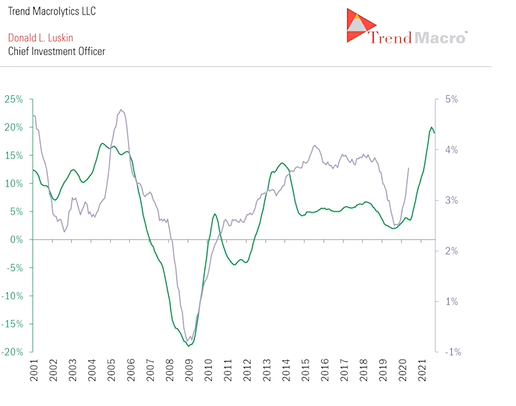
In this chart from Trend Macro, you see the Case Shiller Home Price Index year-over-year in green, and the far right side shows the post-pandemic home price boom. A couple months ago, it was up 20% year over year.
The purple line is an overlay of the year-over-year change in Owners Equivalent Rent (OER). That’s the component of the CPI that represents home prices for people who own homes. This is a little wonky, but home prices aren’t observed directly in CPI. Instead, they look at the price to rent a home, and they assume that if you own your home, you’re implicitly paying that rent to yourself.
Because rental contracts only renew every year or two, the data lags about 18 months.
So that means it’s reasonable to assume this purple line will reach the level of the green line…and if it does, it will likely hit the worst level in the history of data back in the housing bubble with the 2000s orange equivalent rent at 4.3% year-over-year (right side purple scale).
But it looks like if (when) that does happen, it will only tack on 18 more basis points (bps) to inflation because we already have the big move incorporated in the recent CPI…essentially a 3.5% increase year-over-year is already in the 6.81%.
Sure, OER can go even higher than the 4.3% record from the early 2000s…but even an extra 1% on top of the 4.3% gets it to 5.3%…but that adds 40bps vs 18bps.
40bps is nothing relative to the 3.5% increase that just got backed into the 6.81% CPI.
By the way, the Case Shiller rate of change measurement here (again green line and left scale) has actually started coming down…see that hook down on the very right end of the green line?
Looks transitory to me. But wait, there’s more…if you order in the next 15 minutes, I’ll throw in my thoughts on….
Cars
I don’t have a whole lot of analysis here because I think it’s simple – people are buying cars for all the usual reasons, and maybe some people who are scared to take public transportation are buying cars, too. So I’m gonna assume demand is normal. Chip and parts shortages are shrinking the supply side for new cars, which drives buyers to the supply of used cars. Demand > Supply. My opinion: the supply side will fix itself in 2022.
I don’t see oil doubling from current prices, I think the catch-up increase in rents won’t add much to inflation relative to what it just added, and cars fix themselves in 2022.
It’s not a popular opinion, but it’s MY opinion…inflation is probably transitory.
What am I not factoring in? Build Back Better (BBB) could pump another $2T into the economy. If that happens, my opinion will end up most likely being wrong.
But I think 6.81% CPI just pulled the plug on BBB in 2021 because of one thing…
Well, one person.
Joe Manchin.
Joe Manchin last week on Wall Street Journal CEO Council reminded everyone that 17 Nobel Laureates claimed back in February that the big government spending package would NOT be inflationary. Here’s what he said –
“We had people at that time saying inflation will be transitory. We had 17 Nobel Laureates saying it’s going to be no problem. Well, 17 Nobel laureates were wrong.”
So I think BBB is off the table this year, and since next year is a mid-term election year, it’s not gonna happen then either. Without BBB, I’m fairly convinced that inflation is transitory.
I know I’m in the minority, and I’m no CPI/inflation expert, BUT the Fuel/Rent/Cars contribution and BBB unlikely is what has shaped my opinion.
Since it was a big news event with people taking sides, I thought I’d share my thinking.
Keep looking forward,


David B. Armstrong, CFA
President & Co-Founder
Dave got into the industry when he discovered his passion for finance in his mid-20’s. He’s a combat veteran and served as an officer in the United States Marines Corps on both active duty and in the reserves, retiring at the rank of Lieutenant Colonel. While serving on active duty, Dave was unable to spend money on deployments, so he became a self-taught investor. Along with a few bucks cash as a bouncer, his investing performance grew to be good....
Recent Posts
By David B. Armstrong, CFA
IMPORTANT DISCLOSURE INFORMATION
Please remember that past performance is no guarantee of future results. Different types of investments involve varying degrees of risk, and there can be no assurance that the future performance of any specific investment, investment strategy, or product (including the investments and/or investment strategies recommended or undertaken by Monument Capital Management, LLC [“Monument”]), or any non-investment related content, made reference to directly or indirectly in this blog will be profitable, equal any corresponding indicated historical performance level(s), be suitable for your portfolio or individual situation, or prove successful. Due to various factors, including changing market conditions and/or applicable laws, the content may no longer be reflective of current opinions or positions. Moreover, you should not assume that any discussion or information contained in this blog serves as the receipt of, or as a substitute for, personalized investment advice from Monument. To the extent that a reader has any questions regarding the applicability of any specific issue discussed above to his/her individual situation, he/she is encouraged to consult with the professional advisor of his/her choosing. No amount of prior experience or success should be construed that a certain level of results or satisfaction will be achieved if Monument is engaged, or continues to be engaged, to provide investment advisory services. Monument is neither a law firm nor a certified public accounting firm and no portion of the blog content should be construed as legal or accounting advice.
A copy of Monument’s current written disclosure Brochure discussing our advisory services and fees is available for review upon request or at www.monumentwealthmanagement.com/disclosures. Please Note: Monument does not make any representations or warranties as to the accuracy, timeliness, suitability, completeness, or relevance of any information prepared by any unaffiliated third party, whether linked to Monument’s website or blog or incorporated herein, and takes no responsibility for any such content. All such information is provided solely for convenience purposes only and all users thereof should be guided accordingly.
Historical performance results for investment indices, benchmarks, and/or categories have been provided for general informational/comparison purposes only, and generally do not reflect the deduction of transaction and/or custodial charges, the deduction of an investment management fee, nor the impact of taxes, the incurrence of which would have the effect of decreasing historical performance results. It should not be assumed that your Monument account holdings correspond directly to any comparative indices or categories. Please Also Note: (1) performance results do not reflect the impact of taxes; (2) comparative benchmarks/indices may be more or less volatile than your Monument accounts; and, (3) a description of each comparative benchmark/index is available upon request.
Please Remember: If you are a Monument client, please contact Monument, in writing, if there are any changes in your personal/financial situation or investment objectives for the purpose of reviewing/evaluating/revising our previous recommendations and/or services, or if you would like to impose, add, or to modify any reasonable restrictions to our investment advisory services. Unless, and until, you notify us, in writing, to the contrary, we shall continue to provide services as we do currently. Please Also Remember to advise us if you have not been receiving account statements (at least quarterly) from the account custodian.