Our “Off The Wall” Blog
is now Monument #Unfiltered
Subscribe below to receive our unique, straight-forward, unfiltered wealth advice delivered straight to your inbox.
A Horrible Jobs Report

Before you start reading this week’s blog – PLEASE READ MY LATEST US NEWS AND WORLD REPORT COLUMN.
It’s amusing and instructive with facts about market corrections and behavior. It ties in a good Seinfeld episode too.
If there was any doubt, Friday’s disappointing labor report is one of the signs that the U.S. economy appears to have entered “Growth Problem 3.0” – a 3rd slowdown in growth in as many years. In addition to the jobs report, signs of Growth Problem 3.0 include the near 10% decline in the Standard & Poor’s 500, the continued decline in commodities process, and the looming Fiscal Cliff.
Here’s how the market ended up for the week.
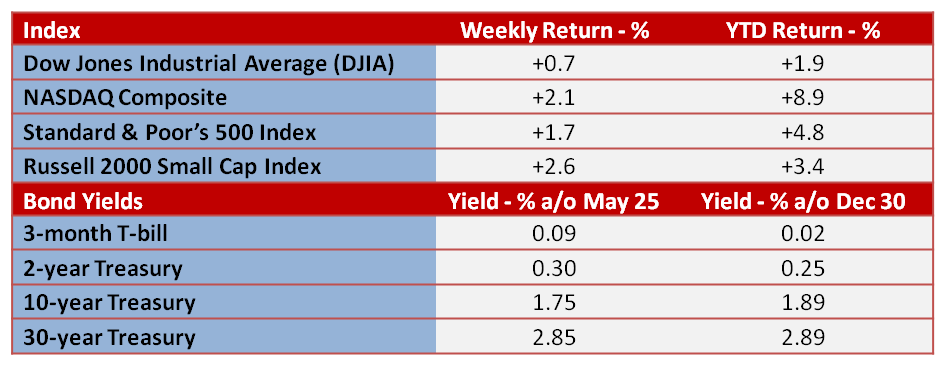
I want to provide a recap of the horrible job numbers from Friday which sent investors rushing out of stocks and commodities and into the perceived safety of Treasuries.
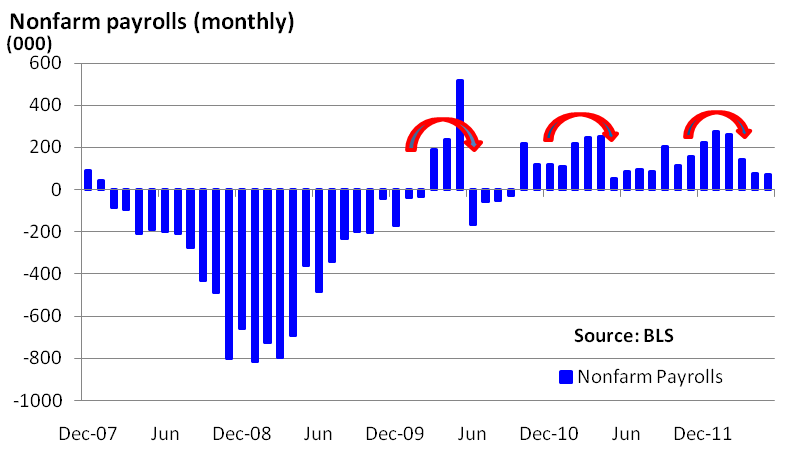
First, the unemployment rate moved up from 8.1% in April to 8.2% in May. Second, and more significantly, nonfarm payrolls rose a miserable 69,000 last month. That ended up being less than half the analysts’ forecasts while April was revised from 115,000 to 77,000.
What does that mean? It means businesses don’t have the growth opportunities that would require a significant number of new employees.
Here’s how the graph looks over the past 3 years…note that employment comes back and there are no recessions in 2010 or 2011.
Meanwhile, Europe continued to impact the U.S. markets, except this time Spain was replacing Greece as the source of worry. The growing lack of confidence in Spain’s perceived inability to recapitalize its banks is resulting in ever-increasing yields on its government debt. That means it becomes more expensive to borrow, and this feeds the fear.
If you extrapolate this out (my apologies to fellow Artillerymen who are having TFT nightmares at that very word) there are fears that this could spread to Ireland, Portugal and Italy. The problem is that this places the survivability of the euro in doubt.
So, what do you get from all that? Boom – weakness in equities because it increases the possibility of a sharp euro-zone recession, which would hurt earnings of U.S. firms that do business in Europe. It could also impact U.S. financials.
Worries about the global economy have done damage to commodities, including oil. The good news is drivers are benefiting from the falling gasoline prices just as the summer driving season begins.
Given all of this, there is a lot of pressure on Fed Chief Ben Bernanke. He will testify on Thursday before a congressional committee on the economic outlook, the latest job report, and on Europe. It will all get plenty of air play.
What should you do? Unless your need for short-term liquidity has changed, you should likely do nothing right now. AGAIN PLEASE SEE MY LAST US NEWS AND WORLD REPORT COLUMN.
My patience has been rewarded twice before on slowing growth and I’m going to stick to my guns until I see growth slowing so much that it’s looking like a recession. And right now, I don’t see the “R” word happening. Gross Domestic Product (GDP) is probably going to be ratcheted down from 2.5% to 2.0% over this week, and 2.0% is a long way from zero or negative numbers. I’m not saying it can’t happen, I’m just saying that I don’t see it yet.
And don’t discount the possibility that European politicians could craft a headline that would provide support in the markets. They’ve done it before.
Remember – volatility can send stocks in either direction. Does everyone remember last year?
IMPORTANT NOTE: Due to industry regulations, comments are not permitted on this blog. If you would like to contact the author, please email us at info@monumentwm.com.
Securities and Financial Planning offered through LPL Financial, a Registered Investment Advisor. Member FINRA/SIPC
The opinions voiced in this material are for general information only and are not intended to provide specific advice or recommendations for any individual. To determine which investment(s) may be appropriate for you, consult your financial advisor prior to investing. All performance referenced is historical and is no guarantee of future results. All indices are unmanaged and cannot be invested into directly. Stock investing involves risk including loss of principal. The Dow Jones Industrial Average is comprised of 30 stocks that are major factors in their industries, and widely held by individuals and institutional investors. The Standard & Poor’s 500 Stock Index (S&P 500) is an unmanaged capitalization weighted index of 500 stocks designed to measure performance of the broad domestic economy through changes in the aggregate market value of 500 stocks representing all major industries. The NASDAQ Composite Index measures all domestic and non-U.S. based common stocks listed on The NASDAQ Stock Market. The market value, the last sale price multiplied by total shares outstanding, is calculated throughout the trading day, and is related to the total value of the Index. The Russell 2000 Small Stock Index is an unmanaged index generally representative of the 2000 smallest companies in the Russell 3000 Index. The Russell 2000 is an unmanaged index generally comprised of companies with lower price-to-book ratios and lower forecasted growth values. The 2, 10, and 30 year Treasure yield is simply the yield at the close of the day for the noted historical time period

David B. Armstrong, CFA
President & Co-Founder
Dave got into the industry when he discovered his passion for finance in his mid-20’s. He’s a combat veteran and served as an officer in the United States Marines Corps on both active duty and in the reserves, retiring at the rank of Lieutenant Colonel. While serving on active duty, Dave was unable to spend money on deployments, so he became a self-taught investor. Along with a few bucks cash as a bouncer, his investing performance grew to be good....
IMPORTANT DISCLOSURE INFORMATION
Please remember that past performance is no guarantee of future results. Different types of investments involve varying degrees of risk, and there can be no assurance that the future performance of any specific investment, investment strategy, or product (including the investments and/or investment strategies recommended or undertaken by Monument Capital Management, LLC [“Monument”]), or any non-investment related content, made reference to directly or indirectly in this blog will be profitable, equal any corresponding indicated historical performance level(s), be suitable for your portfolio or individual situation, or prove successful. Due to various factors, including changing market conditions and/or applicable laws, the content may no longer be reflective of current opinions or positions. Moreover, you should not assume that any discussion or information contained in this blog serves as the receipt of, or as a substitute for, personalized investment advice from Monument. To the extent that a reader has any questions regarding the applicability of any specific issue discussed above to his/her individual situation, he/she is encouraged to consult with the professional advisor of his/her choosing. No amount of prior experience or success should be construed that a certain level of results or satisfaction will be achieved if Monument is engaged, or continues to be engaged, to provide investment advisory services. Monument is neither a law firm nor a certified public accounting firm and no portion of the blog content should be construed as legal or accounting advice.
A copy of Monument’s current written disclosure Brochure discussing our advisory services and fees is available for review upon request or at www.monumentwealthmanagement.com/disclosures. Please Note: Monument does not make any representations or warranties as to the accuracy, timeliness, suitability, completeness, or relevance of any information prepared by any unaffiliated third party, whether linked to Monument’s website or blog or incorporated herein, and takes no responsibility for any such content. All such information is provided solely for convenience purposes only and all users thereof should be guided accordingly.
Historical performance results for investment indices, benchmarks, and/or categories have been provided for general informational/comparison purposes only, and generally do not reflect the deduction of transaction and/or custodial charges, the deduction of an investment management fee, nor the impact of taxes, the incurrence of which would have the effect of decreasing historical performance results. It should not be assumed that your Monument account holdings correspond directly to any comparative indices or categories. Please Also Note: (1) performance results do not reflect the impact of taxes; (2) comparative benchmarks/indices may be more or less volatile than your Monument accounts; and, (3) a description of each comparative benchmark/index is available upon request.
Please Remember: If you are a Monument client, please contact Monument, in writing, if there are any changes in your personal/financial situation or investment objectives for the purpose of reviewing/evaluating/revising our previous recommendations and/or services, or if you would like to impose, add, or to modify any reasonable restrictions to our investment advisory services. Unless, and until, you notify us, in writing, to the contrary, we shall continue to provide services as we do currently. Please Also Remember to advise us if you have not been receiving account statements (at least quarterly) from the account custodian.