Our “Off The Wall” Blog
is now Monument #Unfiltered
Subscribe below to receive our unique, straight-forward, unfiltered wealth advice delivered straight to your inbox.
Feeling Like CRAP – What Investor Sentiment is Saying Right Now (and What it’s Suggesting About the Future)
I feel like investors are reaching a point of losing faith…and maybe that’s good.
But how is that measured? How do we gain insight into the way people are FEELING about the market?
Well, you will hear a ton about “consumer sentiment” this week because two reports used to measure how people are feeling are due this week.
On Tuesday, we will get the Consumer Confidence Index report, and on Friday, we will get the University of Michigan Consumer Sentiment Index report. These two upcoming reports come on the heels of last week’s American Association of Individual Investors Sentiment Survey (the AAII Survey) – more on that below.
Look, I don’t think anyone expects a ton of gleeful bullishness from the upcoming reports, but what do they help us understand?
Here are some of my thoughts, perspectives, and opinions.
According to the AAII, the Sentiment Survey “offers insight into the opinions of individual investors by asking them their thoughts on where the market is heading in the next six months and has been doing so since 1987.” More can be found here.
So, by looking at the last AAII Survey, you’ll see as of 9/212022, almost 61% of those surveyed are bearish about the upcoming six months in the market.
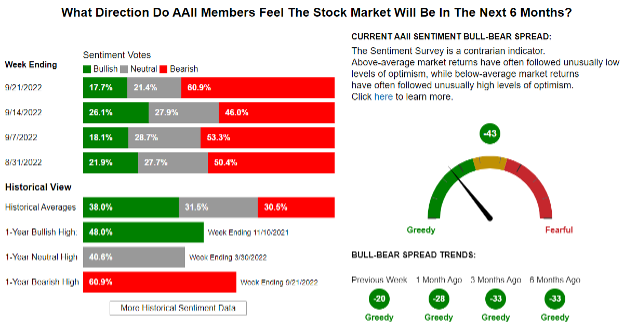
That’s a lot of investor fear and worry.
But…let’s put that into some historical context by looking back in time.
This is the fifth time since 1987 that the survey has hit a 60% bearish reading.
It’s also the highest level of bearish sentiment since the very first week in March of 2009 when the percentage of bearish votes hit 70.3%.
BTDubs (By the way), that date should ring familiar as the bottom of the Great Financial Crisis bear market. But what does that actually tell us?
While nothing will accurately predict the future no matter how high someone’s conviction is, let’s at least look at what happened the four other times the votes hit a 60% bearish level.
In 1999, the survey hit the 60% bear mark on 8/31/1990 and again on 10/19/1990…that was the Gulf War and oil price spike. I would have felt bearish, too. (In fact, talk about bearish, I was in infantry training as a Marine Corps Second Lieutenant.)
Anyway, 12 months after each of those two dates, the S&P 500 was up 23% and 26%, respectively.
After that, the reading didn’t hit the 60% mark again until 10/9/2008.
That should be a time most everyone remembers feeling pretty shitty…Lehman Brothers had just collapsed, JP Morgan bought Bear Stearns for what amounted to pennies on the dollar, and Merrill Lynch almost went out of business over a weekend and had to be rescued by Bank of America in the 11th hour.
It was when another advisor friend of mine said, and I’m not making this up, “I think we could see the S&P 500 literally go to zero.”
Twelve months later, the S&P 500 was up 18%.
The 4th time the survey hit a reading of 60% or higher was on March 5th, 2009.
The percentage of bearish voters got to 70.3%, the highest bearish reading in survey history.
Twelve months later, the S&P 500 was up 67%.
What will happen this time is something that no one can forecast. However, I will offer that it is a seemingly decent signal that we are much closer to the market bottoming out that an indication that things will continue to get much worse.
Could things get worse?
Of course they could. However, let’s look at the S&P 500 afterward:
- 30 days after the date the survey hit a 60% reading, only ONE of those four instances posted a negative return…at – 2.3%.
- Ninety days later, two of the four instances were negative, and those losses were -0.01% (so let’s be optimistic here and call it zero) and -2.2%.
- Six months later, there was one instance where the S&P 500 was negative. And that loss was -5.6%…but that was six months after the 10/9/2008 survey, so that makes sense as the market was climbing out of a deep hole.
It’s also worth mentioning that of the four previous times the threshold crossed 60%, it was clumped into the calendar year of 1990 and essentially a six-month window between 2008 and 2009.
To be clear, I’m not suggesting there aren’t legitimate concerns – I will write more about those in the coming days.
I’m just suggesting that a lot of people aren’t expecting the market to get better,
And frankly, that may just be one of the most significant risks facing investors right now. People should keep owing the stocks of good companies that are still doing good business. If you don’t need the money today but are selling those companies simply because you don’t like seeing them trading at the same level as March of 2021, that’s a mistake.
Be sure to listen to our most recent episode of our Off The Wall Podcast, where Erin, Jessica, and I discuss this in further detail—it’ll be posted by close of business today (9/27/2022).
Keep looking forward.

David B. Armstrong, CFA
President & Co-Founder
Dave got into the industry when he discovered his passion for finance in his mid-20’s. He’s a combat veteran and served as an officer in the United States Marines Corps on both active duty and in the reserves, retiring at the rank of Lieutenant Colonel. While serving on active duty, Dave was unable to spend money on deployments, so he became a self-taught investor. Along with a few bucks cash as a bouncer, his investing performance grew to be good....
Recent Posts
By David B. Armstrong, CFA
IMPORTANT DISCLOSURE INFORMATION
Please remember that past performance is no guarantee of future results. Different types of investments involve varying degrees of risk, and there can be no assurance that the future performance of any specific investment, investment strategy, or product (including the investments and/or investment strategies recommended or undertaken by Monument Capital Management, LLC [“Monument”]), or any non-investment related content, made reference to directly or indirectly in this blog will be profitable, equal any corresponding indicated historical performance level(s), be suitable for your portfolio or individual situation, or prove successful. Due to various factors, including changing market conditions and/or applicable laws, the content may no longer be reflective of current opinions or positions. Moreover, you should not assume that any discussion or information contained in this blog serves as the receipt of, or as a substitute for, personalized investment advice from Monument. To the extent that a reader has any questions regarding the applicability of any specific issue discussed above to his/her individual situation, he/she is encouraged to consult with the professional advisor of his/her choosing. No amount of prior experience or success should be construed that a certain level of results or satisfaction will be achieved if Monument is engaged, or continues to be engaged, to provide investment advisory services. Monument is neither a law firm nor a certified public accounting firm and no portion of the blog content should be construed as legal or accounting advice.
A copy of Monument’s current written disclosure Brochure discussing our advisory services and fees is available for review upon request or at www.monumentwealthmanagement.com/disclosures. Please Note: Monument does not make any representations or warranties as to the accuracy, timeliness, suitability, completeness, or relevance of any information prepared by any unaffiliated third party, whether linked to Monument’s website or blog or incorporated herein, and takes no responsibility for any such content. All such information is provided solely for convenience purposes only and all users thereof should be guided accordingly.
Historical performance results for investment indices, benchmarks, and/or categories have been provided for general informational/comparison purposes only, and generally do not reflect the deduction of transaction and/or custodial charges, the deduction of an investment management fee, nor the impact of taxes, the incurrence of which would have the effect of decreasing historical performance results. It should not be assumed that your Monument account holdings correspond directly to any comparative indices or categories. Please Also Note: (1) performance results do not reflect the impact of taxes; (2) comparative benchmarks/indices may be more or less volatile than your Monument accounts; and, (3) a description of each comparative benchmark/index is available upon request.
Please Remember: If you are a Monument client, please contact Monument, in writing, if there are any changes in your personal/financial situation or investment objectives for the purpose of reviewing/evaluating/revising our previous recommendations and/or services, or if you would like to impose, add, or to modify any reasonable restrictions to our investment advisory services. Unless, and until, you notify us, in writing, to the contrary, we shall continue to provide services as we do currently. Please Also Remember to advise us if you have not been receiving account statements (at least quarterly) from the account custodian.