Our “Off The Wall” Blog
is now Monument #Unfiltered
Subscribe below to receive our unique, straight-forward, unfiltered wealth advice delivered straight to your inbox.
So The Dow Hit 20,000… What Does That Mean For You?
First – we feel like Monument is just one of those places that does a great job recruiting and retaining great employees. While not all of them remain, we love to highlight how hard work and good decisions lead to greater success down the road.
Many of you may remember Kristen Owen. Kristen started with us as a recent MBA grad and freshly minted with her CFA designation. After life circumstances prompted a move to Philadelphia and then New York, she began pursuit of a career in Equity Research. Since November of 2013, she has been working hard in that industry and just last week reached out to us to let us know she had received a promotion to Director at Oppenheimer & Co.
A big congrats to Kristen – we love seeing former colleagues achieving success. She is a talent and they are lucky to have her.
This Week
Several times a year, the global economic and event calendar ends up with a week of a dozen or so high-profile events.
This is one of them.
While no one is expecting any changes, the Federal Reserve, the Bank of Japan, and the Bank of England all meet this week. On the political front, in addition to what may happen in the U.S., the U.K. Parliament will vote on whether to authorize Prime Minister Theresa May to move forward with Brexit. Oh, then later in the week, the leaders of the European Union will meet to discuss what is next. Oh, then January data on Institution for Supply Management (ISM), vehicle sales, and the January employment report will all be out. Finally, we will see overseas data to include GDP reports in the Eurozone, India, Mexico, and Indonesia.
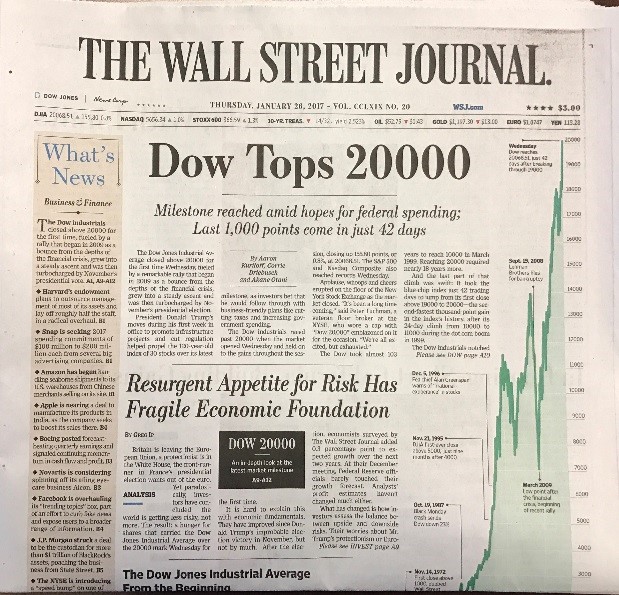
DOW 20,000
The big deal for the week (in finance anyway) was the Dow Jones Industrial Average crossing 20,000 level for the first time ever.
We realize that it is a milestone and it’s one we want to recognize, but we also want everyone to remember this – if you are driving the 16 or so hours from D.C. to Miami, this is no more important than crossing the North Carolina / South Carolina state line.
Milestone, yes…Importance to the overall journey? No more so than crossing the previous mile marker.
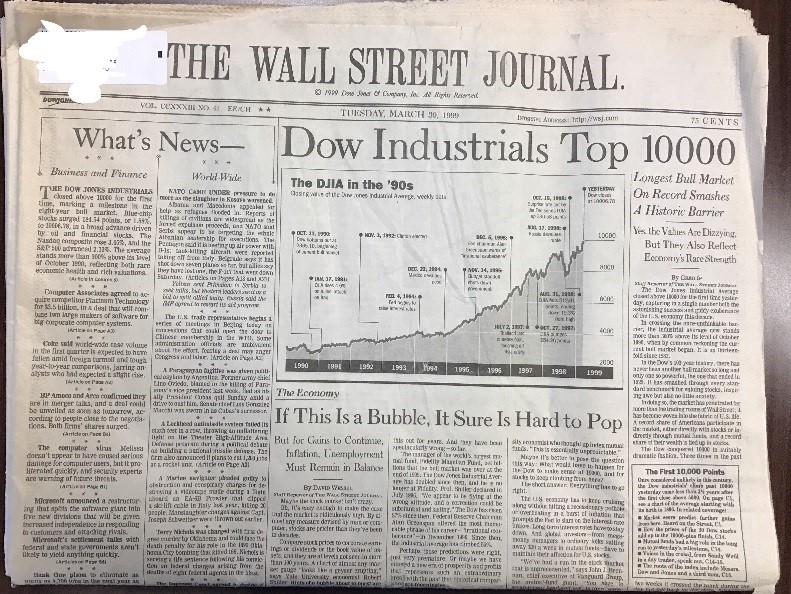
As shown in the chart below from Bespoke, the Dow first hit 10,000 back in March of 1999. I remember it well. In fact, I saved my copy of the Wall Street Journal from that very day. I was just entering the business. Little did I know that it would take until January 25th, 2017 to hit 20,000.
So while it may seem like it took forever to finally cross, it was actually the second quickest 1,000-point jump for the index. It only took 64 days to go from 19,000 to 20,000. As also shown in the chart, only the jump from 10,000 to 11,000 happened faster…that one took 35 days.
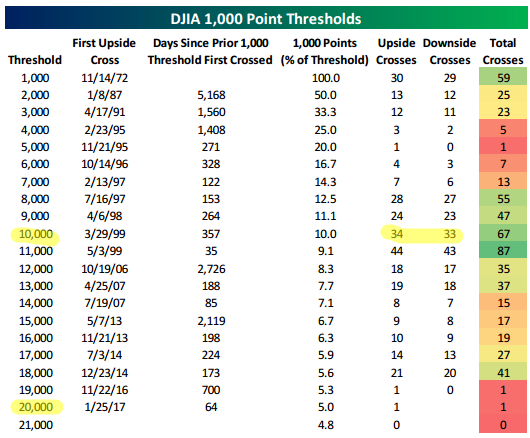
Also of interest, the 19,000 and 5,000 index levels are the only two 1,000-point thresholds that did not have a “downside cross” before the next 1,000-point threshold was hit.
So what, right? Well remember this – interesting data is not the same thing as actionable data. I think people get all wound up in data and they think it means that there is supposed to be something to glean and action should be taken.
In this case, it’s just interesting data – no action required.
That Leads Us To Dow 30,000, Right?
Haha! Well Barron’s had a cover over the weekend titled, “Next Stop Dow 30,000”.
Oh jeeezzzzz…COME ON BARRON’S!!!
As you might imagine, it caused quite a buzz. I read a few articles and blips on social media that many people feel this cover could be a bearish signal. It’s often referred to as the “magazine cover indicator” and is thought of by many as a contrarian indicator.
Basically, it refers to the thought that once something is so collectively subscribed to and it makes the cover of a magazine, the trend could be very well closer to the end than the beginning.
However, what is important to note from the article is the forecast of 30,000 by 2025 – which comes out to roughly a 5% annual gain. That’s well in line with the long-term average for the Dow and not far off from what most people shoot for in a long-term financial plan.
So…maybe this cover isn’t quite as outlandish as it might appear at first glance.
Earnings – How are Things Looking?
We are now in the thick of earnings season with more than 400 companies having reported their fourth quarter (Q4) 2016 earnings numbers.
Here’s where we are…
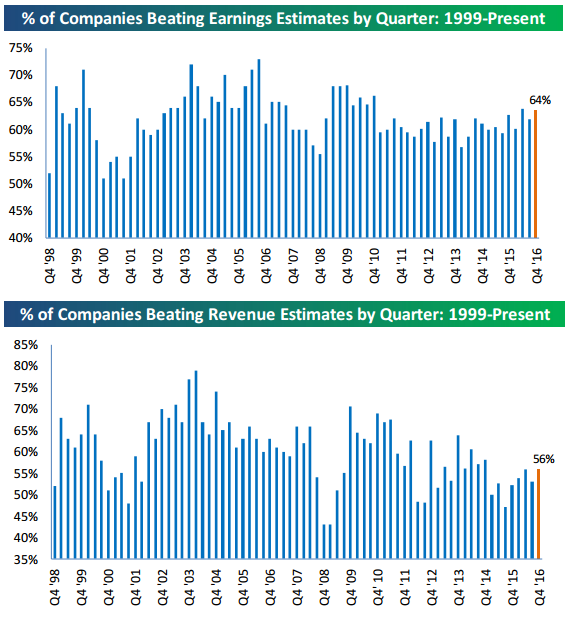
In the chart below from Bespoke, you can see that 64% of companies that have reported this season have beaten consensus earnings per share estimates. Additionally, 56% of companies have beaten revenue estimates.
Since the earnings beat rate was at 67% in the middle of last week, a bunch of companies that reported over the last three days of last week posted a relatively weak beat rate. If companies underperform next week as well, the beat rate this season could really dip lower.
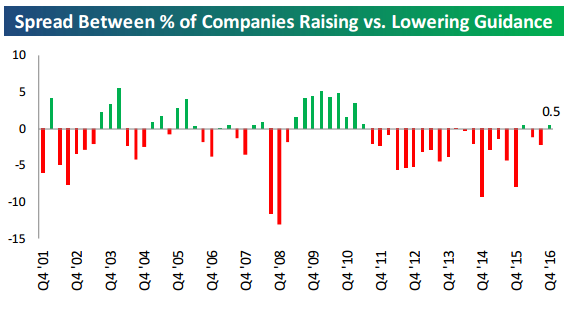
Bespoke also publishes a chart that shows the spread between companies guiding future earnings higher or lower on a percentage basis. The current reading for Q4 of 2016 shows that the spread between companies posting negative guidance versus companies posting positive guidance was at +0.5%.
Basically flat.
The good news is that this is far from the worst (recent) spread reading which stood at -9.4% in Q4 of 2014, which was also the worst reading since the last two quarters of 2008.
Of the last 21 quarters, two were just about flat/negative and one was flat/positive. The rest were solidly negative. It’s interesting to me that companies are guiding lower as the market keeps goes up. If I see this invert, it will have my attention – it could be a good indicator of corporate over-confidence.
GDP
The move up in stocks since the election is a function of looking toward the future rather than the past.
Let’s look at GDP. Last Friday’s release of Q4 Gross Domestic Product (GDP) was a disappointment, rising 1.9% on an annualized basis and below Q3’s 3.5%.
For the year, GDP expanded by a disheartening 1.6%.
Here’s the bummer – GDP has failed to grow by 3.0% annually since the economy came out of the recession in 2009. I have politely called this “tepid growth” in the past, but the fact is that this has never happened in any economic expansion going all the way back to the 1930s.
Charles Sherry recently explained it like this:
“Economic growth depends on two things: the supply of money and the turnover of money (velocity).
It can be described in a simple equation:
Money supply X Velocity of money = GDP”
Let me quickly explain. First, the growth in the money supply has been respectable. In the interest of not turning this into an economy lesson, take my word that this chart proves just that.
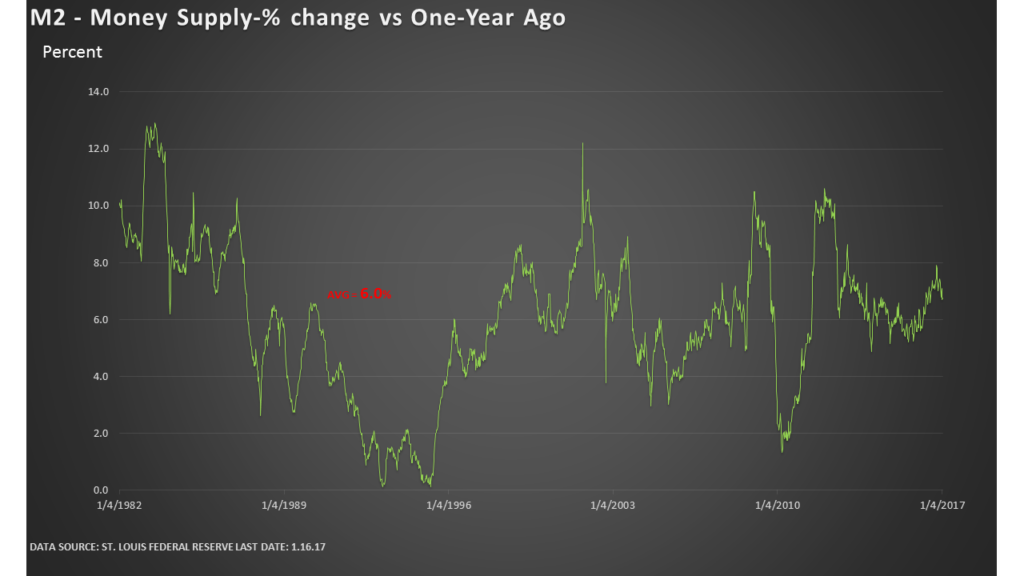
That leaves us with Velocity, or “the turnover” of money. This is roughly defined as how many times a dollar “turns over” each year.
The velocity of money is at the lowest level since at least the late 1950s, as you can see below.
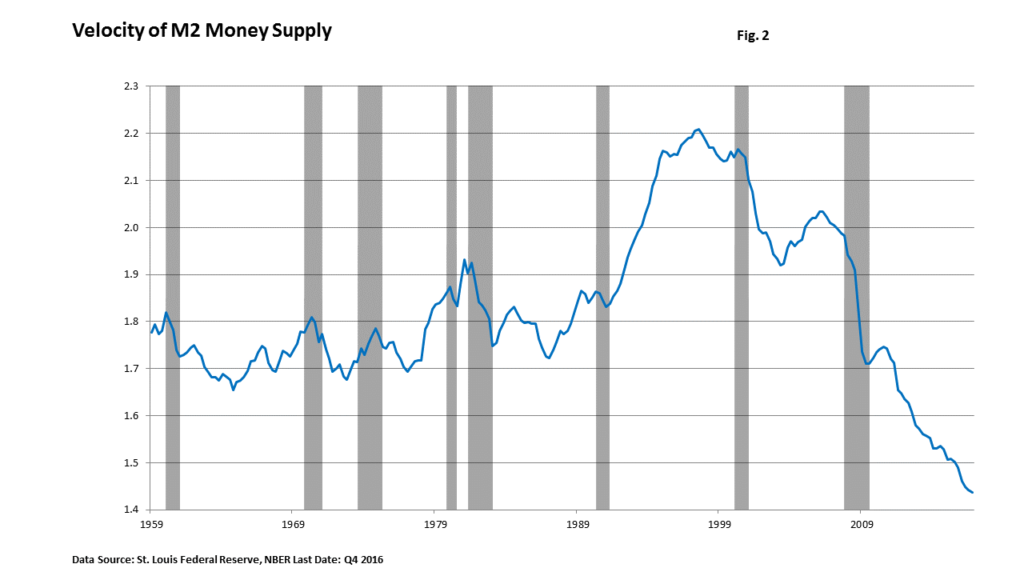
By going back to our equation, here is the math: $13.18 trillion (M2) X 1.436 (Velocity) = $18.9 trillion GDP…and that meshes up with the latest GDP report.
It’s hard to pick up a paper without hearing the term “Animal Spirits” but this is one thing that the term is alluding to. The slowdown in velocity can be blamed on a lack of “animal spirits” in the economy.
Put another way, consumers and businesses have been overly cautious for a variety of reasons. For like, eight years.
There seems to be a lot of confidence that things are going to change and that has optimism up. Bigly. I’ve written about the impact that tax reform would have on earnings as one example of change that is increasing the optimism.
What’s in Store for 2017 & Beyond
I see several reasons to believe that real optimism in the economy is in full swing. Consumer confidence and small business confidence have jumped over the last couple of months and we’ve witnessed a sharp and positive shift in market psychology, as stocks have moved to new highs.
The upturn in confidence may finally spark faster spending and a turnaround in the velocity of money. If so, I think it’s a natural assumption that more robust economic activity will follow.
Call with questions.

Important Disclosure Information
Please remember that past performance may not be indicative of future results. Different types of investments involve varying degrees of risk, and there can be no assurance that the future performance of any specific investment, investment strategy, or product (including the investments and/or investment strategies recommended or undertaken by Monument Wealth Management), or any non-investment related content, made reference to directly or indirectly in this blog will be profitable, equal any corresponding indicated historical performance level(s), be suitable for your portfolio or individual situation, or prove successful. All indexes referenced are unmanaged and cannot be invested into directly. The economic forecasts set forth may not develop as predicted. Due to various factors, including changing market conditions and/or applicable laws, the content may no longer be reflective of current opinions or positions. Moreover, you should not assume that any discussion or information contained in this blog serves as the receipt of, or as a substitute for, personalized investment advice from Monument Wealth Management. To the extent that a reader has any questions regarding the applicability of any specific issue discussed above to his/her individual situation, he/she is encouraged to consult with the professional advisor of his/her choosing. Monument Wealth Management is neither a law firm nor a certified public accounting firm and no portion of the blog content should be construed as legal or accounting advice. A copy of Monument Wealth Management’s current written disclosure statement discussing our advisory services and fees is available for review upon request.

David B. Armstrong, CFA
President & Co-Founder
Dave got into the industry when he discovered his passion for finance in his mid-20’s. He’s a combat veteran and served as an officer in the United States Marines Corps on both active duty and in the reserves, retiring at the rank of Lieutenant Colonel. While serving on active duty, Dave was unable to spend money on deployments, so he became a self-taught investor. Along with a few bucks cash as a bouncer, his investing performance grew to be good....
IMPORTANT DISCLOSURE INFORMATION
Please remember that past performance is no guarantee of future results. Different types of investments involve varying degrees of risk, and there can be no assurance that the future performance of any specific investment, investment strategy, or product (including the investments and/or investment strategies recommended or undertaken by Monument Capital Management, LLC [“Monument”]), or any non-investment related content, made reference to directly or indirectly in this blog will be profitable, equal any corresponding indicated historical performance level(s), be suitable for your portfolio or individual situation, or prove successful. Due to various factors, including changing market conditions and/or applicable laws, the content may no longer be reflective of current opinions or positions. Moreover, you should not assume that any discussion or information contained in this blog serves as the receipt of, or as a substitute for, personalized investment advice from Monument. To the extent that a reader has any questions regarding the applicability of any specific issue discussed above to his/her individual situation, he/she is encouraged to consult with the professional advisor of his/her choosing. No amount of prior experience or success should be construed that a certain level of results or satisfaction will be achieved if Monument is engaged, or continues to be engaged, to provide investment advisory services. Monument is neither a law firm nor a certified public accounting firm and no portion of the blog content should be construed as legal or accounting advice.
A copy of Monument’s current written disclosure Brochure discussing our advisory services and fees is available for review upon request or at www.monumentwealthmanagement.com/disclosures. Please Note: Monument does not make any representations or warranties as to the accuracy, timeliness, suitability, completeness, or relevance of any information prepared by any unaffiliated third party, whether linked to Monument’s website or blog or incorporated herein, and takes no responsibility for any such content. All such information is provided solely for convenience purposes only and all users thereof should be guided accordingly.
Historical performance results for investment indices, benchmarks, and/or categories have been provided for general informational/comparison purposes only, and generally do not reflect the deduction of transaction and/or custodial charges, the deduction of an investment management fee, nor the impact of taxes, the incurrence of which would have the effect of decreasing historical performance results. It should not be assumed that your Monument account holdings correspond directly to any comparative indices or categories. Please Also Note: (1) performance results do not reflect the impact of taxes; (2) comparative benchmarks/indices may be more or less volatile than your Monument accounts; and, (3) a description of each comparative benchmark/index is available upon request.
Please Remember: If you are a Monument client, please contact Monument, in writing, if there are any changes in your personal/financial situation or investment objectives for the purpose of reviewing/evaluating/revising our previous recommendations and/or services, or if you would like to impose, add, or to modify any reasonable restrictions to our investment advisory services. Unless, and until, you notify us, in writing, to the contrary, we shall continue to provide services as we do currently. Please Also Remember to advise us if you have not been receiving account statements (at least quarterly) from the account custodian.