Our “Off The Wall” Blog
is now Monument #Unfiltered
Subscribe below to receive our unique, straight-forward, unfiltered wealth advice delivered straight to your inbox.
A Big Week for Fireworks on Wall Street

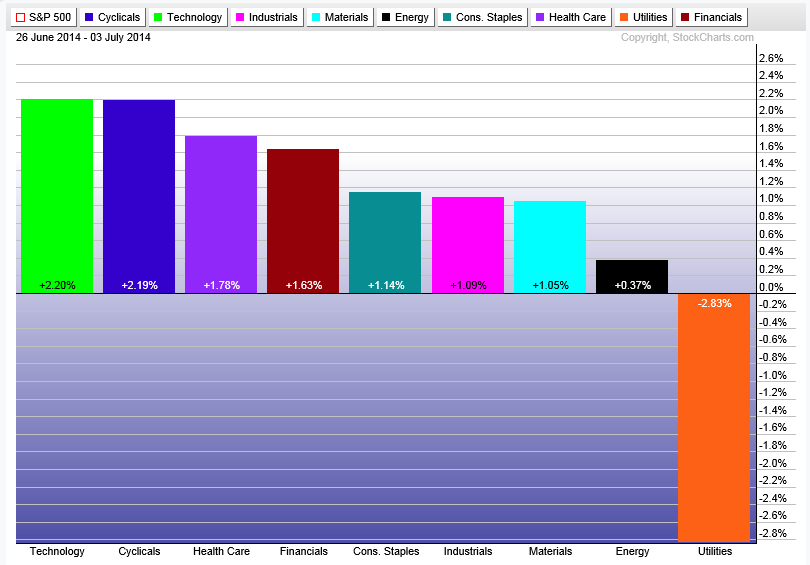
July certainly got off to a great start after closing out the month of June, the end of the second quarter AND the first half of the year. What a first half it was – anyone who thought Utilities would have led the ten sectors of the S&P 500 in terms of return for the first half of 2014, please take a bow. (We are not bowing, by the way…). For those who are curious, the picture is from the old School House Rock series, The Shot Heard Round the World.
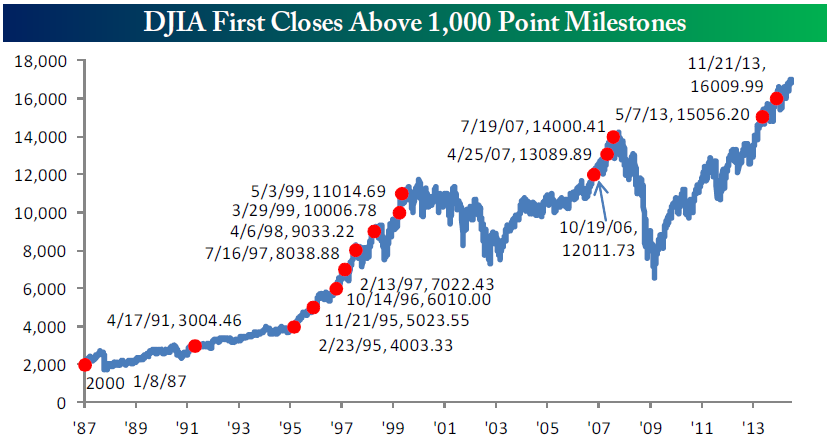
We hit new highs last week with the Dow Jones Industrial Average (DJIA) and the S&P 500. Both posted a 1.3% gain on a short trading week. The move in the DJIA pressed the venerable index through 17000 for the first time in history.
Here’s a fun chart…love those guys at Bespoke. Anyway, MAN – were we spoiled in the 1990’s or WHAT!?! I got out of the Marine Corps in 1996 to pursue a career in finance. By the time I was out of the Corps and through my MBA program it was the fall of 1999. Bummer…
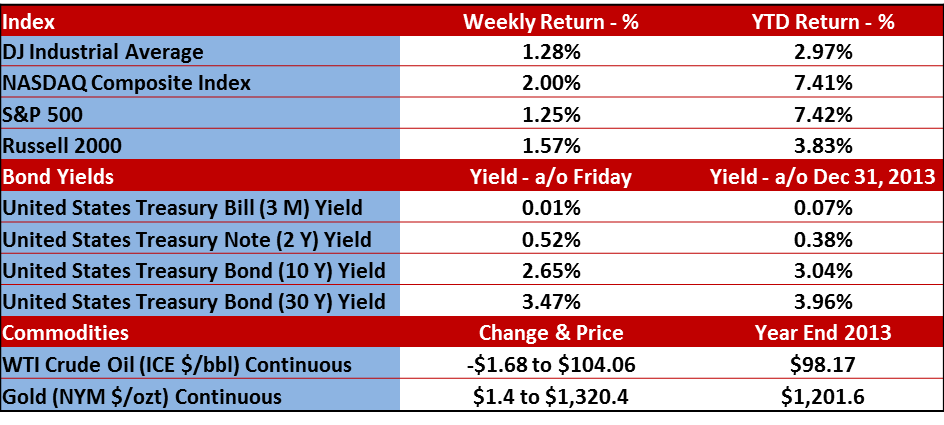
Back to the DJIA. While it is the ‘Grand Ole Man of the Market’, and definitely the one that gets all the news, the S&P 500 outpaced the DJIA by over four percentage points for the first half of 2014.
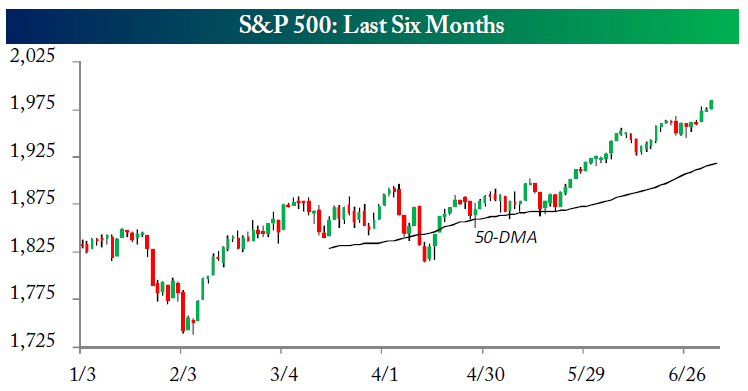
Here’s a chart from Bespoke that shows the year-to-date of the S&P 500 which was also up 1.3% on the week. Of note is how sideways we were from basically early March through late May.
Then BOOM. Up.
It’s also nice to see the small-cap indices, which got HAMMERED in the early spring, get back to within striking distance of new highs as well. More details in our regular charts below.
Lots of News
First, there was a ton of money that came in from institutional investors on the first day of the new quarter that started July first. That helped get us off to a great start to the third quarter (less than 180 days to Christmas – yes, that dreaded, politically incorrect term that sends shivers down the spine of most people regardless of individual faith…).
Second, we had the June labor report that came out suggesting that the economy is coming out of the horrible damage caused by winter. Specifically, we had nonfarm payroll rise by 288k (vs. an estimate of 215k) which was the fifth month in a row that we saw that report with a number north of 200k and the strongest six months of job gains since 1999. See below for a good graphic.
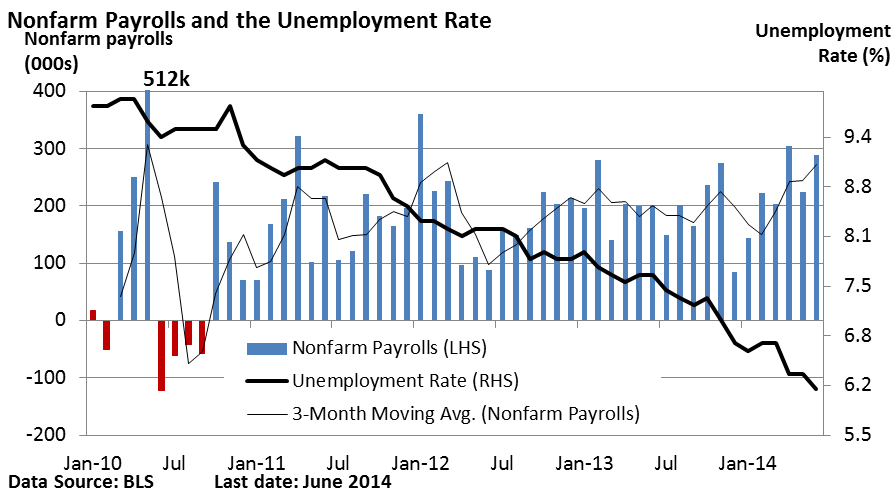
Oh, and the unemployment rate fell from 6.3% to 6.1%. Given that this report is coming down faster than the smarty pants at the Fed have projected, it’s possible that we will be somewhere in the mid 5% range by year end. People will start questioning the logic behind a 5-5.5% unemployment rate coupled with a Fed Funds rate of 0%…but if I was north of the Wall and a giant White Walker made me guess, I’d say there is little appetite for an increase in that rate prior to a critical mid-term election this fall. Kudo’s to you and your TV addiction if you get my last reference.
Also, the labor force participation rate is around 63%, which is the lowest rate since the late 1970’s. It means that 33% of people are so discouraged about the job situation that they have stopped looking for jobs and more people that are working part-time are indicating that they wish they had full-time jobs. So the low unemployment rate is something that is only important to politicians at this point and the employment situation may not be as rosy to everyone as the rate suggests. So the Fed may keep the easy money flowing for that reason too.
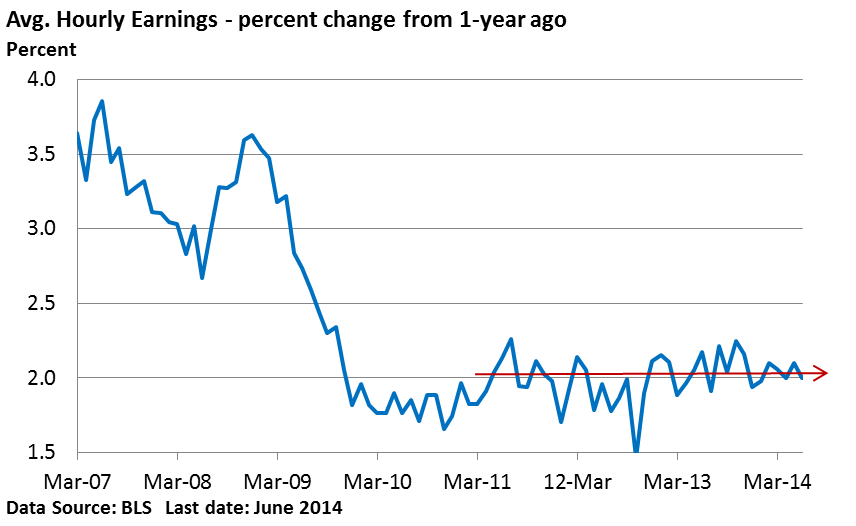
One other employment-related piece of news is that the average hourly earnings has held at the same level for a long period of time. The chart below shows the percentage of year-over-year change in wages going back to 2007. Note the section from 2010 forward. It’s supply and demand. Since there is a high supply of qualified workers available to companies, there is no demand for higher wages. So again, a low unemployment rate is not the whole story.
Here’s the chart. Translation: Meh
Low wage growth is good for corporate profits. On that note, tomorrow starts EARNINGS SEASON when Alcoa reports after the closing bell. Things won’t get really fun until later in July when we see 266 companies report the week of July 24th and 311 report on the week of July 31st.
Stay tuned for that.
 Important Disclosure Information
Please remember that past performance may not be indicative of future results. Different types of investments involve varying degrees of risk, and there can be no assurance that the future performance of any specific investment, investment strategy, or product (including the investments and/or investment strategies recommended or undertaken by Monument Wealth Management), or any non-investment related content, made reference to directly or indirectly in this blog will be profitable, equal any corresponding indicated historical performance level(s), be suitable for your portfolio or individual situation, or prove successful. Due to various factors, including changing market conditions and/or applicable laws, the content may no longer be reflective of current opinions or positions. Moreover, you should not assume that any discussion or information contained in this blog serves as the receipt of, or as a substitute for, personalized investment advice from Monument Wealth Management. To the extent that a reader has any questions regarding the applicability of any specific issue discussed above to his/her individual situation, he/she is encouraged to consult with the professional advisor of his/her choosing. Monument Wealth Management is neither a law firm nor a certified public accounting firm and no portion of the blog content should be construed as legal or accounting advice. A copy of Monument Wealth Management’s current written disclosure statement discussing our advisory services and fees is available for review upon request.

David B. Armstrong, CFA
President & Co-Founder
Dave got into the industry when he discovered his passion for finance in his mid-20’s. He’s a combat veteran and served as an officer in the United States Marines Corps on both active duty and in the reserves, retiring at the rank of Lieutenant Colonel. While serving on active duty, Dave was unable to spend money on deployments, so he became a self-taught investor. Along with a few bucks cash as a bouncer, his investing performance grew to be good....
IMPORTANT DISCLOSURE INFORMATION
Please remember that past performance is no guarantee of future results. Different types of investments involve varying degrees of risk, and there can be no assurance that the future performance of any specific investment, investment strategy, or product (including the investments and/or investment strategies recommended or undertaken by Monument Capital Management, LLC [“Monument”]), or any non-investment related content, made reference to directly or indirectly in this blog will be profitable, equal any corresponding indicated historical performance level(s), be suitable for your portfolio or individual situation, or prove successful. Due to various factors, including changing market conditions and/or applicable laws, the content may no longer be reflective of current opinions or positions. Moreover, you should not assume that any discussion or information contained in this blog serves as the receipt of, or as a substitute for, personalized investment advice from Monument. To the extent that a reader has any questions regarding the applicability of any specific issue discussed above to his/her individual situation, he/she is encouraged to consult with the professional advisor of his/her choosing. No amount of prior experience or success should be construed that a certain level of results or satisfaction will be achieved if Monument is engaged, or continues to be engaged, to provide investment advisory services. Monument is neither a law firm nor a certified public accounting firm and no portion of the blog content should be construed as legal or accounting advice.
A copy of Monument’s current written disclosure Brochure discussing our advisory services and fees is available for review upon request or at www.monumentwealthmanagement.com/disclosures. Please Note: Monument does not make any representations or warranties as to the accuracy, timeliness, suitability, completeness, or relevance of any information prepared by any unaffiliated third party, whether linked to Monument’s website or blog or incorporated herein, and takes no responsibility for any such content. All such information is provided solely for convenience purposes only and all users thereof should be guided accordingly.
Historical performance results for investment indices, benchmarks, and/or categories have been provided for general informational/comparison purposes only, and generally do not reflect the deduction of transaction and/or custodial charges, the deduction of an investment management fee, nor the impact of taxes, the incurrence of which would have the effect of decreasing historical performance results. It should not be assumed that your Monument account holdings correspond directly to any comparative indices or categories. Please Also Note: (1) performance results do not reflect the impact of taxes; (2) comparative benchmarks/indices may be more or less volatile than your Monument accounts; and, (3) a description of each comparative benchmark/index is available upon request.
Please Remember: If you are a Monument client, please contact Monument, in writing, if there are any changes in your personal/financial situation or investment objectives for the purpose of reviewing/evaluating/revising our previous recommendations and/or services, or if you would like to impose, add, or to modify any reasonable restrictions to our investment advisory services. Unless, and until, you notify us, in writing, to the contrary, we shall continue to provide services as we do currently. Please Also Remember to advise us if you have not been receiving account statements (at least quarterly) from the account custodian.