Barron’s – STOCK ALERT
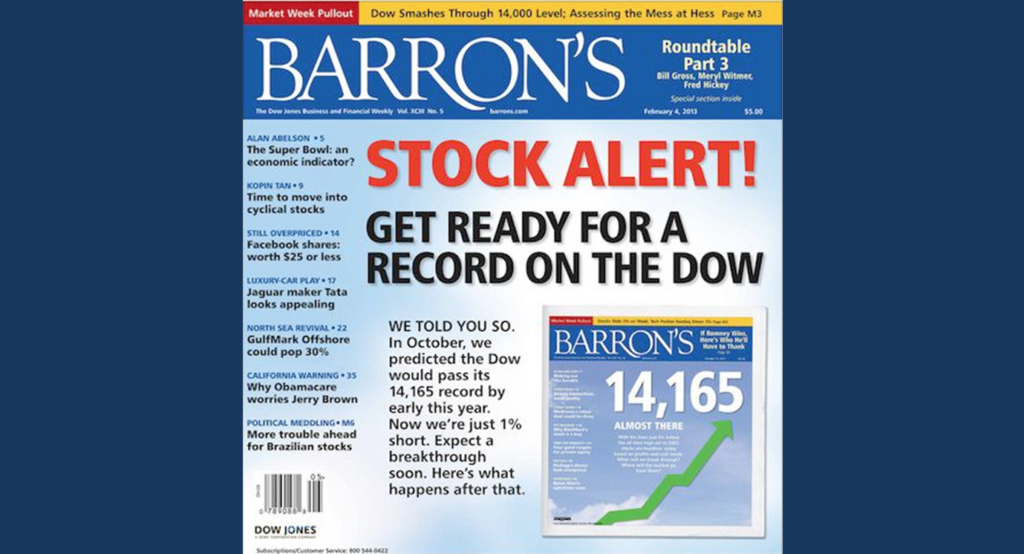
This was the cover of Barron’s this weekend. Ugh…it’s usually a bad sign when euphoria takes over. But I’m not convinced that the press is really euphoric about the Dow Jones Industrial Average (DJIA) reaching 14,000 again nor the Standard & Poor’s 500 (S&P 500) closing over 1500. There seems to be much more of a “the market is WAY overbought” spin of disbelief than a “better jump in while the water is still warm” mentality. In fact, on our Facebook Page, there was a link to one of our recent blogs that highlighted that the DJIA was within 2% of closing at its all time high. One Facebook fan commented, “Which means it’s time to get out of stocks…like Buffett etc.” I must have missed the news that Buffett was going to cash in his equity portfolio – it was probably buried under every written column published this weekend highlighting the recent rally in the market.
I’ll have a few thoughts on all of this below, but first, here’s a recap of how the market did last week.

 Please – not another CNBC countdown ticker. It’s driving me nuts. Countdowns to an explosion that’s going to go off around me, great, I appreciate that. Countdowns for a rocket ship about to blast off, also a nice touch. The ball dropping in Time Square for News Years – sounds nice, but I’m not sure what that even looks like since I’m usually asleep by 11:15. The market reaching it’s historical high…please, give it a break. But as you can see from the lower right hand corner, there it is…
Here’s why everyone thinks it’s a big deal. Below is a chart from Burt White at LPL Financial which shows the last two times the S&P 500 reached 1500. Notice the dates? Notice the sell offs? Recognize that pit in your stomach?

The first cross of 1500 was on 3/22/2000. That was about 3,239 days ago – go ahead, check my counting skills. I had just started in this business so to me it feels like a ba-ga-zillion days ago. (That’s a number – look it up!)
Now, usually a countdown ticker and a Barron’s cover like the one you see above are causes for concern. I’m not saying investors shouldn’t be cautious, I’m just saying that it’s not appropriate to jump to conclusions.
Why? Well for one big reason, earnings are a lot better. And the equity market follows earnings. See, in 2000, the earnings on the S&P 500 were about $60 in a HUGE tech bubble. Then, in 2007, earnings were around $80 and the financial crisis hit. Those were huge events that caused a sell off.
Today? With 712 companies having announced earnings, 62.2% have beaten their revenue expectations and 63.1% have beaten their bottom line earning per share estimates. For those of you keeping score of this excitement, percentage of ‘beats’ is way better than any quarter since the final quarter of 2010. Current earnings expectations for the S&P 500 are now right around $102 with an improving employment picture, a housing situation that seems to only be getting better, and both business and consumer spending showing some pretty strong numbers. Couple that with historically low interest rates, low inflation and a lot of cash on the sidelines, and I think the picture looks a lot better now than in 2000 and 2007. Let’s not gloss over the ISM Manufacturing report which printed a surprise reading of 53.1 when the expected number was 50.6. The ISM Services report comes out this week.
Yes, the GDP report last Wednesday was a -0.1m, but we think that ultimately gets revised up to a positive number. (I suspect some government spending was pulled from the 4th quarter into the 3rd quarter to help economic reports because, you know, there was that election thingy…)
Yes, the initial jobless claims last week were a cause for disappointment (they rose by 38,000), but the four week moving average is still at 352,000 which is pretty close to a post-recession low. Oh, and since President Obama took over, the net job losses are 161k (5.135m lost vs. 4.975m gained)…however, when you break out the government jobs, the private sector jobs have grown by 472k (5.051m private jobs lost vs. 5.523m gained). Somehow, President Obama’s massive expansion of government has been a drag on overall job growth – I’ll send an awesome MWM Nike Golf hat to the first person who can answer why, AND I’ll acknowledge you by name in next week’s blog (if you want people to know that you actually read this far).
Look, there is just too much good stuff happening right now for me to think that there will be another drastic drop in the equity markets simply because we reached the old high. This bull market is a healthy one. I think all the disbelief in the press is actually good. If they were making everyone feel like they were missing out on something, I’d be really scared. If I saw the cover of a magazine with the title “18 year old becomes a ka-ba-zillionaire by inventing a new shoelace” I’d be scared.
 One only needs to remember back to how the press was treating “Dow 10,000” to know what I mean. Until then, don’t succumb to fear just because the index reaches a certain number. Nor should you be overly excited about the index reaching a certain number. Why were people excited over Dow 10,000 but fearful of 14,000? …I still have a Dow 10,000 hat somewhere.
So, how do you see things? Are the lights half on or half off? Ok – too soon for Super Bowl jokes?
Please call or email with questions.
IMPORTANT NOTE: Due to industry regulations, comments are not permitted on this blog. If you would like to contact the author, please email us at info@monumentwm.com.
Securities and Financial Planning offered through LPL Financial, a Registered Investment Advisor. Member FINRA/SIPC
The opinions voiced in this material are for general information only and are not intended to provide specific advice or recommendations for any individual. To determine which investment(s) may be appropriate for you, consult your financial advisor prior to investing. All performance referenced is historical and is no guarantee of future results. All indices are unmanaged and cannot be invested into directly. Stock investing involves risk including loss of principal. The Dow Jones Industrial Average is comprised of 30 stocks that are major factors in their industries, and widely held by individuals and institutional investors. The Standard & Poor’s 500 Stock Index (S&P 500) is an unmanaged capitalization weighted index of 500 stocks designed to measure performance of the broad domestic economy through changes in the aggregate market value of 500 stocks representing all major industries. The NASDAQ Composite Index measures all domestic and non-U.S. based common stocks listed on The NASDAQ Stock Market. The market value, the last sale price multiplied by total shares outstanding, is calculated throughout the trading day, and is related to the total value of the Index. The Russell 2000 Small Stock Index is an unmanaged index generally representative of the 2000 smallest companies in the Russell 3000 Index. The Russell 2000 is an unmanaged index generally comprised of companies with lower price-to-book ratios and lower forecasted growth values. The 2, 10 and 30 year Treasury is simply the yield at the close of the day.
(1) West Texas Intermediate crude spot price is as of end of week.
(2) London Bullion Market Association; gold fixing pricing at 3 p.m. London time.

David B. Armstrong, CFA
President & Co-Founder
Dave got into the industry when he discovered his passion for finance in his mid-20’s. He’s a combat veteran and served as an officer in the United States Marines Corps on both active duty and in the reserves, retiring at the rank of Lieutenant Colonel. While serving on active duty, Dave was unable to spend money on deployments, so he became a self-taught investor. Along with a few bucks cash as a bouncer, his investing performance grew to be good....
IMPORTANT DISCLOSURE INFORMATION
Please remember that past performance is no guarantee of future results. Different types of investments involve varying degrees of risk, and there can be no assurance that the future performance of any specific investment, investment strategy, or product (including the investments and/or investment strategies recommended or undertaken by Monument Capital Management, LLC [“Monument”]), or any non-investment related content, made reference to directly or indirectly in this blog will be profitable, equal any corresponding indicated historical performance level(s), be suitable for your portfolio or individual situation, or prove successful. Due to various factors, including changing market conditions and/or applicable laws, the content may no longer be reflective of current opinions or positions. Moreover, you should not assume that any discussion or information contained in this blog serves as the receipt of, or as a substitute for, personalized investment advice from Monument. To the extent that a reader has any questions regarding the applicability of any specific issue discussed above to his/her individual situation, he/she is encouraged to consult with the professional advisor of his/her choosing. No amount of prior experience or success should be construed that a certain level of results or satisfaction will be achieved if Monument is engaged, or continues to be engaged, to provide investment advisory services. Monument is neither a law firm nor a certified public accounting firm and no portion of the blog content should be construed as legal or accounting advice.
A copy of Monument’s current written disclosure Brochure discussing our advisory services and fees is available for review upon request or at www.monumentwealthmanagement.com/disclosures. Please Note: Monument does not make any representations or warranties as to the accuracy, timeliness, suitability, completeness, or relevance of any information prepared by any unaffiliated third party, whether linked to Monument’s website or blog or incorporated herein, and takes no responsibility for any such content. All such information is provided solely for convenience purposes only and all users thereof should be guided accordingly.
Historical performance results for investment indices, benchmarks, and/or categories have been provided for general informational/comparison purposes only, and generally do not reflect the deduction of transaction and/or custodial charges, the deduction of an investment management fee, nor the impact of taxes, the incurrence of which would have the effect of decreasing historical performance results. It should not be assumed that your Monument account holdings correspond directly to any comparative indices or categories. Please Also Note: (1) performance results do not reflect the impact of taxes; (2) comparative benchmarks/indices may be more or less volatile than your Monument accounts; and, (3) a description of each comparative benchmark/index is available upon request.
Please Remember: If you are a Monument client, please contact Monument, in writing, if there are any changes in your personal/financial situation or investment objectives for the purpose of reviewing/evaluating/revising our previous recommendations and/or services, or if you would like to impose, add, or to modify any reasonable restrictions to our investment advisory services. Unless, and until, you notify us, in writing, to the contrary, we shall continue to provide services as we do currently. Please Also Remember to advise us if you have not been receiving account statements (at least quarterly) from the account custodian.