How can my blog compete against Warren Buffet’s annual letter that was released Saturday? You should read it, but here are three segments I liked:
#1
“America’s population is growing about .8% per year (.5% from births minus deaths and .3% from net migration). Thus 2% of overall growth produces about 1.2% of per capita growth. That may not sound impressive. But in a single generation of, say, 25 years, that rate of growth leads to a gain of 34.4% in real GDP per capita.” (Page 8)
MWM Translation – stop being a pessimist.
#2
“For 240 years it’s been a terrible mistake to bet against America, and now is no time to start.” (Also from Page 8)
MWM Translation – Quit focusing on the media-produced issue of the moment…I have several examples below of what I mean by this. Develop a plan, invest according to that plan, organize a liquidity schedule for your cash needs, and understand what impacts any changes will have to your plan and then LEAVE IT ALONE.
#3
“…investors who diversify widely and simply sit tight with their holdings are certain to prosper: In America, gains from winning investments have always far more than offset the losses from clunkers. (During the 20th Century, the Dow Jones Industrial Average – an index fund of sorts – soared from 66 to 11,497, with its component companies all the while paying ever-increasing dividends.)” (Page 23)
MWM Translation – Smart people have a plan and realize that the number of years that the market has positive returns goes way up the longer they are invested. Casinos make a ton of dough with a 50-55% edge over the gambler on most table games. Those percentages are more like 80 and 90% when looking at rolling monthly returns for 3, 5, 10 and 15-year periods.
If it Bleeds, it Leads
Here are some headlines clipped by Charles Sherry from MarketWatch over a few days last week-ish. These outlets do not have anyone’s best interest in mind other than their advertisers.


***These next two are worth noting due to the fact that they are published within HOURS of each other.


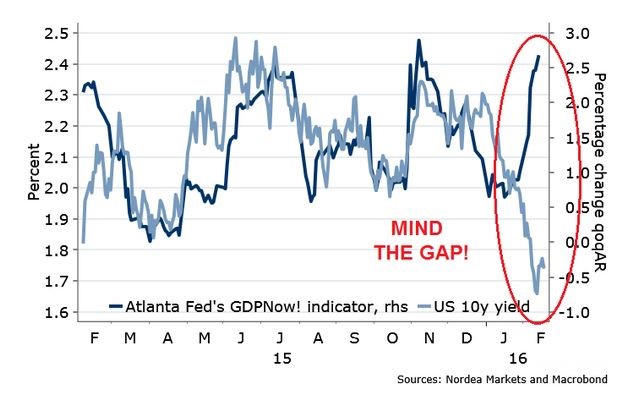
Want to see a great indicator that the market is disconnected? This is a chart that shows the gap between the yield on the U.S. 10-year Treasury and the Atlanta Federal Reserve GDPNow Tracker, which has historically been very accurate.
Houses and Cars
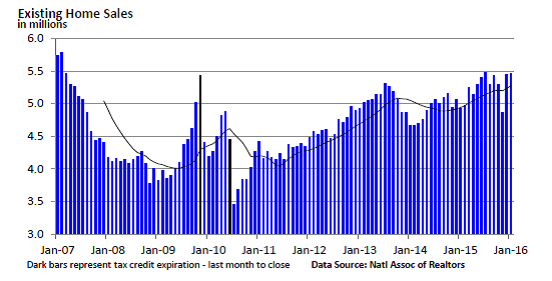
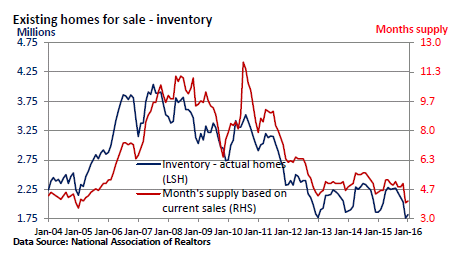
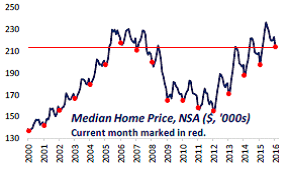
I talk about housing and cars a lot – you can catch up on my thoughts here in our most recent video. I know there was some mediocre WEEKLY news out of the housing market last week, but the below charts show some of what I think are the more important big pictures. Sales going up, prices going up and low inventory. This means people want to buy houses and there are not enough of them. In a simple supply and demand scenario, this will drive more new construction and new construction drives a ton of the economy.
GDP & Other Data
Last week the second Q4 estimate for GDP was revised higher to 1.0% from the first estimate of 0.7%. It was expected that the second estimate would actually come in at 0.2%! A lot of this had to do with inventories which does not make it the BEST report in the world, but it’s better than being revised down or staying the same.
Michigan Confidence came in at 91.7 versus the estimate of 91.0. Personal Income was reported at 0.5% versus the 0.4% estimate. Personal Spending came in at 0.5% versus 0.3%.
If all of this sounds like financial gobbledygook. Just take away that the above is good and supportive of our opinion that we are not heading into a recession. GDP is better, confidence is higher, personal income is higher and people are spending.
Earnings
While earnings are reported all the time, the season is generally recognized to start when Alcoa announces and ends with Walmart announces, as they did last week. I got kind of tired of writing about earnings week after week so since I scaled back and didn’t get any nasty emails, I think I’ll keep this cycle up for next season, too.
Now that we are “Walmart Complete”, let’s take a look at what are referred to as “beat rates” for U.S. stocks that reported numbers this quarter.
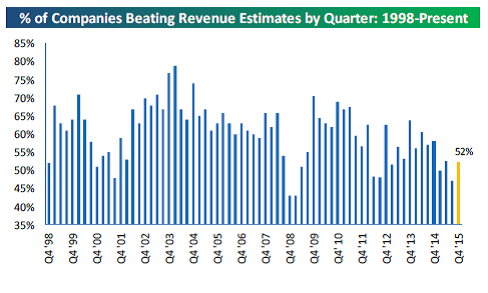
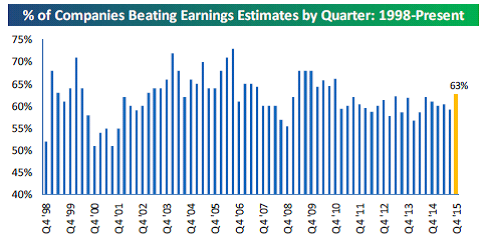
Below are two charts from Bespoke. The first chart shows the percentage of companies that beat consensus analyst revenue estimates, while the second shows the percentage that beat consensus analyst earnings estimates. You can obviously see the prior data too.
At 52%, the revenue beat rate was considerably lower than the earnings beat rate. While it’s low, an encouraging takeaway from the revenue beat rate is that it was stronger than the prior quarter’s reading of just 47%. It will be nice to see this get back to trending higher as it did between mid-2011 and 2014.
As shown, the earnings beat rate ended at 63%, which is actually the highest reading seen in five years, going back to Q4 2010.
The MWM Bottom Line on Earnings
The biggest weight on earnings is the collapse in the Energy sector. As for everyone else, the strong dollar is another drag on the S&P 500 companies. Remember that half of the S&P 500 companies derive their revenue from abroad. The flat yield curve hurts Financials – it’s the main reason why this sector has been a loser when normally it’s a great sector in a recovery. The global economic slowdown is taking a toll on the earnings of the Industrials and to a certain extent the IT sectors too. Finally, we take a look at Retail. While the U.S. consumer is doing pretty well, traditional retailers are losing their market share to Internet retailers. Personally, the only thing I’m not ordering online is a cold beer.
Enjoy the week. Super Tuesday will dominate the media. Be sure to go vote. Here are two pictures I took during an operation to deliver food to a UN Food Distribution site in Baidoa, Somalia back in 1992. Be happy about where you live no matter what your opinions are of candidates or parties. The ability to vote and experience a peaceful transition of power for almost 250 years isn’t a luxury the people in these pictures enjoy. Ever.
Call with questions.


Important Disclosure Information for “3 Takeaways from Warren Buffet’s Annual Letter”
Please remember that past performance may not be indicative of future results. Different types of investments involve varying degrees of risk, and there can be no assurance that the future performance of any specific investment, investment strategy, or product (including the investments and/or investment strategies recommended or undertaken by Monument Wealth Management), or any non-investment related content, made reference to directly or indirectly in this blog will be profitable, equal any corresponding indicated historical performance level(s), be suitable for your portfolio or individual situation, or prove successful. All indexes referenced are unmanaged and cannot be invested into directly. The economic forecasts set forth may not develop as predicted. Due to various factors, including changing market conditions and/or applicable laws, the content may no longer be reflective of current opinions or positions. Moreover, you should not assume that any discussion or information contained in this blog serves as the receipt of, or as a substitute for, personalized investment advice from Monument Wealth Management. To the extent that a reader has any questions regarding the applicability of any specific issue discussed above to his/her individual situation, he/she is encouraged to consult with the professional advisor of his/her choosing. Monument Wealth Management is neither a law firm nor a certified public accounting firm and no portion of the blog content should be construed as legal or accounting advice. A copy of Monument Wealth Management’s current written disclosure statement discussing our advisory services and fees is available for review upon request.


