Our “Off The Wall” Blog
is now Monument #Unfiltered
Subscribe below to receive our unique, straight-forward, unfiltered wealth advice delivered straight to your inbox.
2013 – A Banner Year

2013 was one for the record books – unless you were in cash or betting against the equity markets. This year saw the both the Dow Jones Industrial Average and the Standard & Poor’s 500 (S&P 500) smash through both of their previous highs.
2013 started with the Dow opening at 13,104 and finishing at 16,577. As the Dow passed through the 2007 high of 14,164 there were plenty of cries that it was “time for a pull-back” but Mr. Dow was hearing none of it as it continued its unabated run towards a record year-end close of 16,577. As for the S&P 500, well, at no time during the year was the index trading at a negative YTD loss. In fact, it only had two negative months – June and August. The best month for the S&P 500 was January with just over a 5% gain and the worst month was August with just about a -3.1% loss. Those investors who emotionally timed the market at the previous high (based no doubt on their trusty limbic system gut feelings) were left watching over 2,000 Dow points being added at the final tally of the year.
What will 2014 bring? I’m not lucky enough to put that guess on paper but one thing I can tell you is that just because we are at record levels it does not mean we have a greater chance of a pull-back. What is still interesting to me is the sheer number of people who still do not realize that we are in a bull market and have been since March of 2009. Sure, we have had our ups and downs, but the textbook definition of a bear market is a 20% drop from a previous high. We have not printed a drop like that since the day in March of 2009 when people were still stating that “the market could actually go to zero.”
By the way, it was the 19th best year on record for the Dow but it was the best year since 1995 when the Dow was up 33.5%
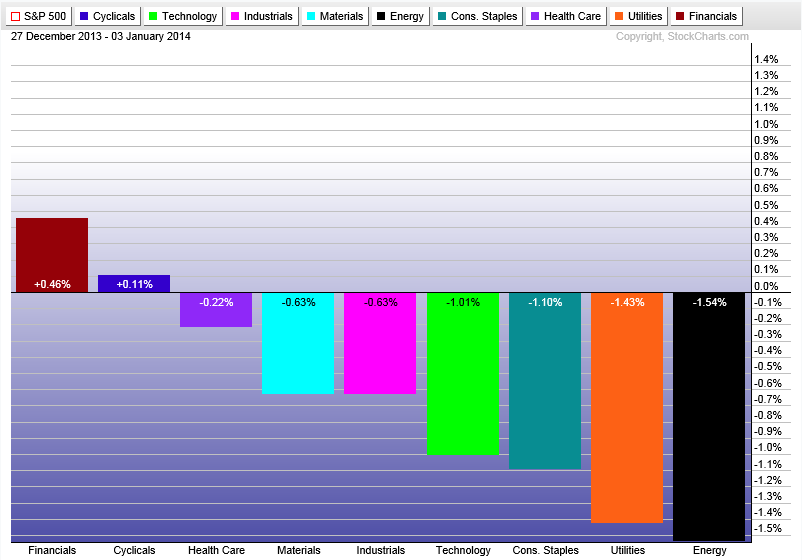
The first week of 2014 returns are below. The weekly return includes the final two days of 2013. I’ll have more on the entirety of 2013 in a 2013 Year End report.

Remember, the graph below shows how well each sector did last week vs. the S&P 500 rather than its actual total return.
Speaking of Bull Markets…
According to Bespoke Investment Group, there are several things to keep in mind about this bull market and bull markets in general. Remember that a common definition of a bull market is any market that starts with a 20% gain and ends with a 20% decline from a high. We began the current Bull market on March 9, 2009 and we have not had a 20% decline yet – so the bull market is still in effect and has been for over 1,760 days. In terms of days, this is a long one but there are five bull markets since 1928 that have been longer with the longest being 4,494 days from December of 1987 until March of 2000. Additionally, the S&P 500 is up over 173% over the current bull market. There are three other bull markets with higher returns… +228%, +267% and +582%
So just because this bull market has been going on for a while with the S&P 500 up over 170%, it does not mean that we are necessarily due for a big pull back. But then again, we could see a 20% decline tomorrow. My point is that unless you have traveled back in time with Biff from Back to the Future with a time table that shows when the market will pull back, your guess is as good as mine on the subject of a pull back. Special thanks to Sam B. today for sparking my desire to round out my thoughts on this… if he read this far!
Please call or email with questions.
Investment advice offered through Monument Advisory Group, LLC a Registered Investment Advisor (RIA).
The opinions voiced in this material are for general information only and are not intended to provide specific advice or recommendations for any individual. To determine which investment(s) may be appropriate for you, consult your financial advisor prior to investing. All performance referenced is historical and is no guarantee of future results. All indices are unmanaged and cannot be invested into directly. Stock investing involves risk including loss of principal. The Dow Jones Industrial Average is comprised of 30 stocks that are major factors in their industries, and widely held by individuals and institutional investors. The Standard & Poor’s 500 Stock Index (S&P 500) is an unmanaged capitalization weighted index of 500 stocks designed to measure performance of the broad domestic economy through changes in the aggregate market value of 500 stocks representing all major industries. The NASDAQ Composite Index measures all domestic and non-U.S. based common stocks listed on The NASDAQ Stock Market. The market value, the last sale price multiplied by total shares outstanding, is calculated throughout the trading day, and is related to the total value of the Index. The Russell 2000 Small Stock Index is an unmanaged index generally representative of the 2000 smallest companies in the Russell 3000 Index. The Russell 2000 is an unmanaged index generally comprised of companies with lower price-to-book ratios and lower forecasted growth values. The 2, 10 and 30 year Treasury is simply the yield at the close of the day.
(1) West Texas Intermediate crude spot price is as of end of week.
(2) London Bullion Market Association; gold fixing pricing at 3 p.m. London time.

David B. Armstrong, CFA
President & Co-Founder
Dave got into the industry when he discovered his passion for finance in his mid-20’s. He’s a combat veteran and served as an officer in the United States Marines Corps on both active duty and in the reserves, retiring at the rank of Lieutenant Colonel. While serving on active duty, Dave was unable to spend money on deployments, so he became a self-taught investor. Along with a few bucks cash as a bouncer, his investing performance grew to be good....
IMPORTANT DISCLOSURE INFORMATION
Please remember that past performance is no guarantee of future results. Different types of investments involve varying degrees of risk, and there can be no assurance that the future performance of any specific investment, investment strategy, or product (including the investments and/or investment strategies recommended or undertaken by Monument Capital Management, LLC [“Monument”]), or any non-investment related content, made reference to directly or indirectly in this blog will be profitable, equal any corresponding indicated historical performance level(s), be suitable for your portfolio or individual situation, or prove successful. Due to various factors, including changing market conditions and/or applicable laws, the content may no longer be reflective of current opinions or positions. Moreover, you should not assume that any discussion or information contained in this blog serves as the receipt of, or as a substitute for, personalized investment advice from Monument. To the extent that a reader has any questions regarding the applicability of any specific issue discussed above to his/her individual situation, he/she is encouraged to consult with the professional advisor of his/her choosing. No amount of prior experience or success should be construed that a certain level of results or satisfaction will be achieved if Monument is engaged, or continues to be engaged, to provide investment advisory services. Monument is neither a law firm nor a certified public accounting firm and no portion of the blog content should be construed as legal or accounting advice.
A copy of Monument’s current written disclosure Brochure discussing our advisory services and fees is available for review upon request or at www.monumentwealthmanagement.com/disclosures. Please Note: Monument does not make any representations or warranties as to the accuracy, timeliness, suitability, completeness, or relevance of any information prepared by any unaffiliated third party, whether linked to Monument’s website or blog or incorporated herein, and takes no responsibility for any such content. All such information is provided solely for convenience purposes only and all users thereof should be guided accordingly.
Historical performance results for investment indices, benchmarks, and/or categories have been provided for general informational/comparison purposes only, and generally do not reflect the deduction of transaction and/or custodial charges, the deduction of an investment management fee, nor the impact of taxes, the incurrence of which would have the effect of decreasing historical performance results. It should not be assumed that your Monument account holdings correspond directly to any comparative indices or categories. Please Also Note: (1) performance results do not reflect the impact of taxes; (2) comparative benchmarks/indices may be more or less volatile than your Monument accounts; and, (3) a description of each comparative benchmark/index is available upon request.
Please Remember: If you are a Monument client, please contact Monument, in writing, if there are any changes in your personal/financial situation or investment objectives for the purpose of reviewing/evaluating/revising our previous recommendations and/or services, or if you would like to impose, add, or to modify any reasonable restrictions to our investment advisory services. Unless, and until, you notify us, in writing, to the contrary, we shall continue to provide services as we do currently. Please Also Remember to advise us if you have not been receiving account statements (at least quarterly) from the account custodian.