If You Got a Problem, Yo I’ll Solve it.

Vanilla Ice – yeah, the guy that spoke to a generation back in 1989. The problem solver. Not many people know that he published a book called the Vanilla Ice Project Real Estate Guide that was about how to succeed in real estate after he completed a renovation project on his home in Palm Beach. Master of the one-hit wonder? I’ll let you decide.
Someone who is anything but a one-hit wonder is Fed Chairman Ben Bernanke, who spoke last week and initially quieted the anxiety concerning the possibility of the Fed cutting back on the $85 billion of monthly bond purchases. However, during a question and answer period, he suggested that they “could step down the pace of purchases” and the market noticed. The market sold off hard on Wednesday after that statement was made.
I thought that reaction was ridiculous and reinforced that following what traders do every day is completely inappropriate for individual investors to be paying attention to. Why? Because the last time the Fed took tightening actions, it was a well laid out, systematic plan that saw 17 straight, 25 basis point increases over two years.
So give me a break. The Fed is not going to just yank the carpet out from underneath everyone in the middle of the night.
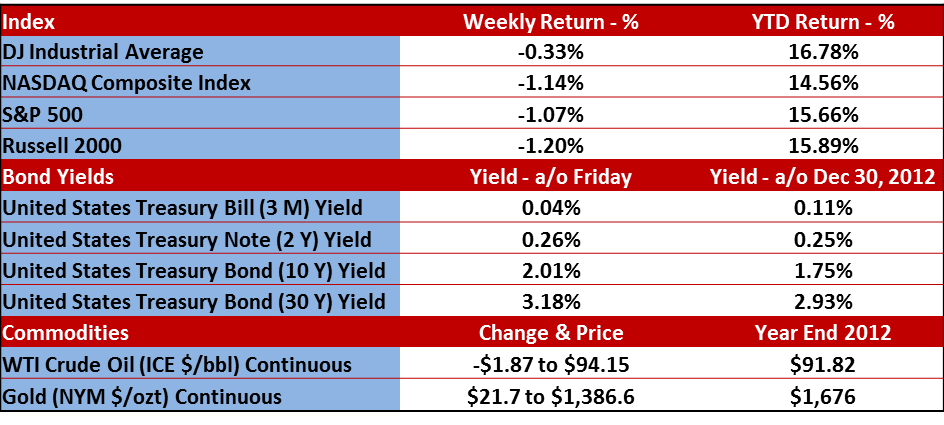
Here’s a recap of how the market did last week.
Worried about a pull back?
With the markets up big time this year, there are a lot of people wondering if there is bound to be a major correction. And frankly, there are a lot of people (according to recent investor sentiment numbers) who still can’t believe that the markets are up as much as they are. They are wondering (dare I say even EXPECTING) about the likelihood of a major correction too.
I think it depends on what you consider a ‘major correction’. In my mind, it’s a 20% correction from the high. That’s also the classic measurement for a switch from a bull to a bear market. But let’s look at the likelihood of a correction of 5, 10 and 20 percent.
According to Ned Davis Research (NDR) which goes back to 1928, the Standard and Poor’s 500 (S&P 500) index has had 294 corrections of 5% or more. Of those 294 times, 94 have been greater than 10%. Of those 94, 25 have been more than 20%. That means there will probably be 3.5 corrections of 5% every year, one correction of 10% each year and a 20% correction only about once every 3 years.
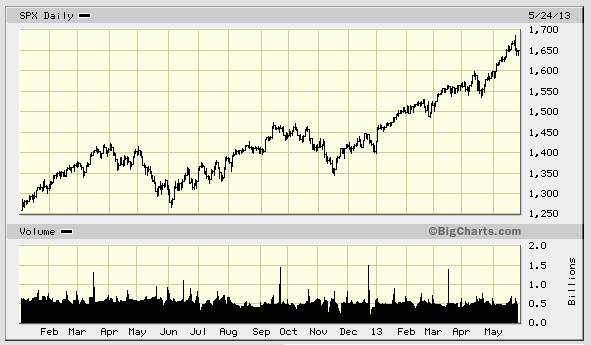
So pullbacks of 5% and even 10% are not good predictors of the market entering a full blown 20% pull back. I’d like everyone to remember back to 2012 when we had a -10% pull back in the spring and then another pullback over October and November of about -8%. While those two pullbacks were difficult for any fully invested investor to sit through, they did not develop into a major bear market correction and in fact, the market finished up the year in double digits (%) and has not looked back since. Below is a chart from 1/1/2012 through today. The two pullbacks are noted by the red lines.
Finally – I hope everyone took some time to remember fallen heroes over the weekend. Below is a blurry picture but great picture of me and Sergeant Chris McDonald giving the thumbs up to the camera. He was a great American and I miss him every day.

Please call or email with questions.
Investment advice offered through Monument Advisory Group, LLC a Registered Investment Advisor (RIA). Securities offered through LPL Financial. Member FINRA/SIPC. Monument Advisory Group and Monument Wealth Management are separate entities from LPL Financial.
The opinions voiced in this material are for general information only and are not intended to provide specific advice or recommendations for any individual. To determine which investment(s) may be appropriate for you, consult your financial advisor prior to investing. All performance referenced is historical and is no guarantee of future results. All indices are unmanaged and cannot be invested into directly. Stock investing involves risk including loss of principal. The Dow Jones Industrial Average is comprised of 30 stocks that are major factors in their industries, and widely held by individuals and institutional investors. The Standard & Poor’s 500 Stock Index (S&P 500) is an unmanaged capitalization weighted index of 500 stocks designed to measure performance of the broad domestic economy through changes in the aggregate market value of 500 stocks representing all major industries. The NASDAQ Composite Index measures all domestic and non-U.S. based common stocks listed on The NASDAQ Stock Market. The market value, the last sale price multiplied by total shares outstanding, is calculated throughout the trading day, and is related to the total value of the Index. The Russell 2000 Small Stock Index is an unmanaged index generally representative of the 2000 smallest companies in the Russell 3000 Index. The Russell 2000 is an unmanaged index generally comprised of companies with lower price-to-book ratios and lower forecasted growth values. The 2, 10 and 30 year Treasury is simply the yield at the close of the day.
(1) West Texas Intermediate crude spot price is as of end of week.
(2) London Bullion Market Association; gold fixing pricing at 3 p.m. London time.

David B. Armstrong, CFA
President & Co-Founder
Dave got into the industry when he discovered his passion for finance in his mid-20’s. He’s a combat veteran and served as an officer in the United States Marines Corps on both active duty and in the reserves, retiring at the rank of Lieutenant Colonel. While serving on active duty, Dave was unable to spend money on deployments, so he became a self-taught investor. Along with a few bucks cash as a bouncer, his investing performance grew to be good....
IMPORTANT DISCLOSURE INFORMATION
Please remember that past performance is no guarantee of future results. Different types of investments involve varying degrees of risk, and there can be no assurance that the future performance of any specific investment, investment strategy, or product (including the investments and/or investment strategies recommended or undertaken by Monument Capital Management, LLC [“Monument”]), or any non-investment related content, made reference to directly or indirectly in this blog will be profitable, equal any corresponding indicated historical performance level(s), be suitable for your portfolio or individual situation, or prove successful. Due to various factors, including changing market conditions and/or applicable laws, the content may no longer be reflective of current opinions or positions. Moreover, you should not assume that any discussion or information contained in this blog serves as the receipt of, or as a substitute for, personalized investment advice from Monument. To the extent that a reader has any questions regarding the applicability of any specific issue discussed above to his/her individual situation, he/she is encouraged to consult with the professional advisor of his/her choosing. No amount of prior experience or success should be construed that a certain level of results or satisfaction will be achieved if Monument is engaged, or continues to be engaged, to provide investment advisory services. Monument is neither a law firm nor a certified public accounting firm and no portion of the blog content should be construed as legal or accounting advice.
A copy of Monument’s current written disclosure Brochure discussing our advisory services and fees is available for review upon request or at www.monumentwealthmanagement.com/disclosures. Please Note: Monument does not make any representations or warranties as to the accuracy, timeliness, suitability, completeness, or relevance of any information prepared by any unaffiliated third party, whether linked to Monument’s website or blog or incorporated herein, and takes no responsibility for any such content. All such information is provided solely for convenience purposes only and all users thereof should be guided accordingly.
Historical performance results for investment indices, benchmarks, and/or categories have been provided for general informational/comparison purposes only, and generally do not reflect the deduction of transaction and/or custodial charges, the deduction of an investment management fee, nor the impact of taxes, the incurrence of which would have the effect of decreasing historical performance results. It should not be assumed that your Monument account holdings correspond directly to any comparative indices or categories. Please Also Note: (1) performance results do not reflect the impact of taxes; (2) comparative benchmarks/indices may be more or less volatile than your Monument accounts; and, (3) a description of each comparative benchmark/index is available upon request.
Please Remember: If you are a Monument client, please contact Monument, in writing, if there are any changes in your personal/financial situation or investment objectives for the purpose of reviewing/evaluating/revising our previous recommendations and/or services, or if you would like to impose, add, or to modify any reasonable restrictions to our investment advisory services. Unless, and until, you notify us, in writing, to the contrary, we shall continue to provide services as we do currently. Please Also Remember to advise us if you have not been receiving account statements (at least quarterly) from the account custodian.