Well, we finally had a negative week in the S&P 500, post-election. It was trading down 0.97% for the week, and ended up at an index level of 2,192. The Dow Jones Industrial Average was barely positive, clocking in with a 0.1% gain on the week to close at 19,170.
There was good news with employment and an interest rate hike is basically a 100% lock, so what gives?
It has been about a year now since the Federal Reserve last raised interest rates. You’ll probably remember back to last December when central bankers decided to raise the fed funds rate by one-fourth of a percentage point to a range of 0.25–0.50%. Then along came 2016, and despite all the babble of the potential for multiple 2016 rate hikes, everything now finally appears to be set up for the Fed to increase JUST ONE TIME this year at the December 13th – 14th meeting.
Whatever – the election is behind us.
Economic growth was reported to have accelerated in the third quarter (Q3) of 2016. GDP rose an upwardly revised 3.2% annualized pace in Q3 (que clapping in the background) AND the November jobs report was positive.
But let’s dive into that…
Last Friday, the U.S. Bureau of Labor Statistics reported nonfarm payrolls rose by 178,000 in November, and the unemployment rate fell from 4.9% in October to 4.6% in November, which was the lowest reading since August of 2007. Be sure to see what I wrote about last week on Weekly First Time Jobless Claims.
So while it’s always nice to see a 178,000 increase, excitement for the drop in the jobless rate should be moderated by the fact that the decline was a function of the shrinking labor force.
Mom, that means that people who were seeking work gave up their search – kind of like when I told you in high school I couldn’t find an after school job so I was going to stop looking. But I was really drinking beer in the woods with my friends.
So “officially”, there are fewer folks who are unemployed.
Here’s how this works. If there are 1,000 total people in the workforce and 900 of them are working, than the percentage of people working is 90%…and the unemployment rate is 10% with 100 people out of work. If 50 people leave the workforce, (meaning they stop looking for a job or reach retirement age and hang it up for a life of golf or fishing), and the same number of people have jobs, then you have 900 people working out of a labor force of 950. Now you have 94.7% of the people working up from 90% with no change in the number of people working. Your unemployment rate just went from 10% to 5.3%…but no new workers. See: “Quarterly Review – Monument Style”
Still, a 4.6% jobless rate suggests labor market conditions are tightening, and that’s just what the Fed wants to see prior to another small increase in interest rates.
Besides, there is no contesting that nearly 15 million jobs have been created since hitting a bottom. As I have said over and over, it’s not that we’ve had a roaring economic recovery, but it’s time for the Fed to hike again. In fact, some would argue it’s overdue.
I think last week’s flat to down market was nothing more than a big deep breath.
Some Thoughts
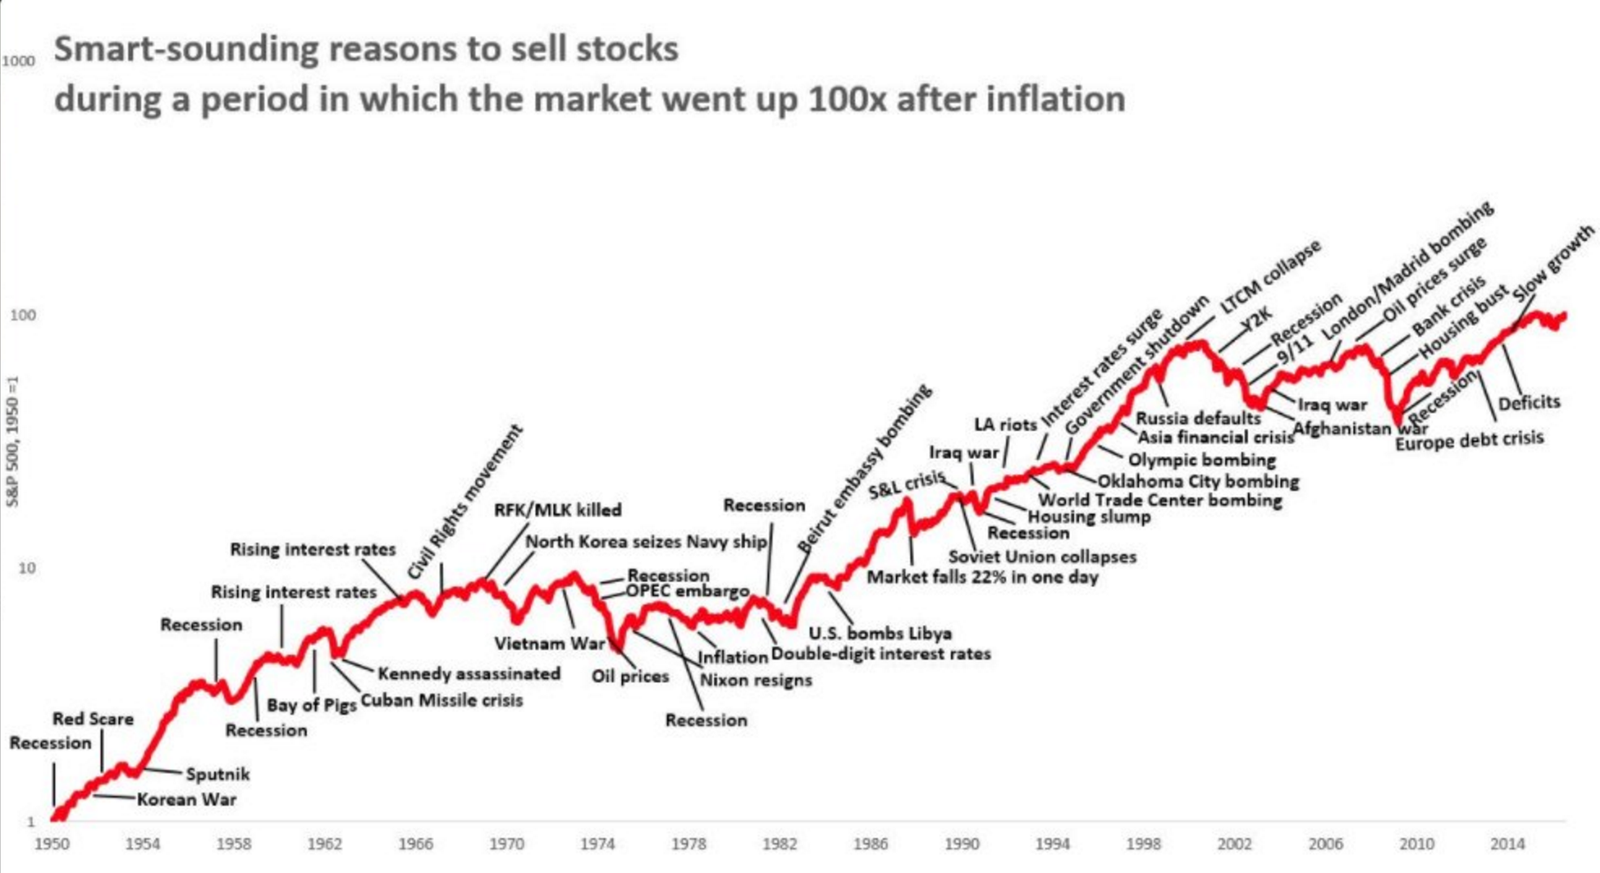
Here’s a graph from Daniel Crosby’s Twitter feed (@danielcrosby). I love the caption because it kind of says it all. I think everyone is guilty of worrying about a global event spelling the end of investing as we know it, but the below really puts things into perspective for me and I hope it does for you, too.

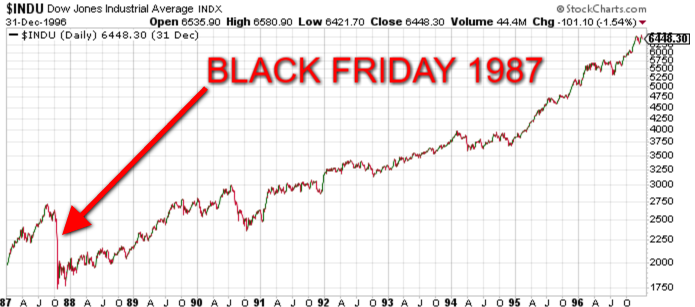
I have a satellite radio in my car and I listen to it all the time. The only break I take from it is to listen to the very interesting Dan Carlin podcasts (I’m currently making my way through Blueprint for Armageddon on World War I). Anyway, as I was listening to a finance show, I heard a guest introduced as “the guy that called the market drop of 1987”. He went on and on about how he called the whole thing, BLAH BLAH BLAH. Anyway, I sat there wondering if the show’s host was going to ask him when he made the call to get back in. He never did. So I’ll fill in the blanks with a chart from StockCharts.com. Annotations are mine.

“Never let the truth get in the way of a good story.” – A anonymous, unsung, obscure Marine Officer, circa 1995.
Taken together, I think you’ll start to infer my point. I just don’t think it’s worth trying to look at events and try to time all the in and out and in and out. See: “Brexit Drama – What Does it Mean for You?”
Unless you are a trader. If you are a trader, then I guess it’s okay. But you are not, because no trader would stoop to reading my blog.
What I’m reminding everyone is to be an investor, not a trader or a speculator.
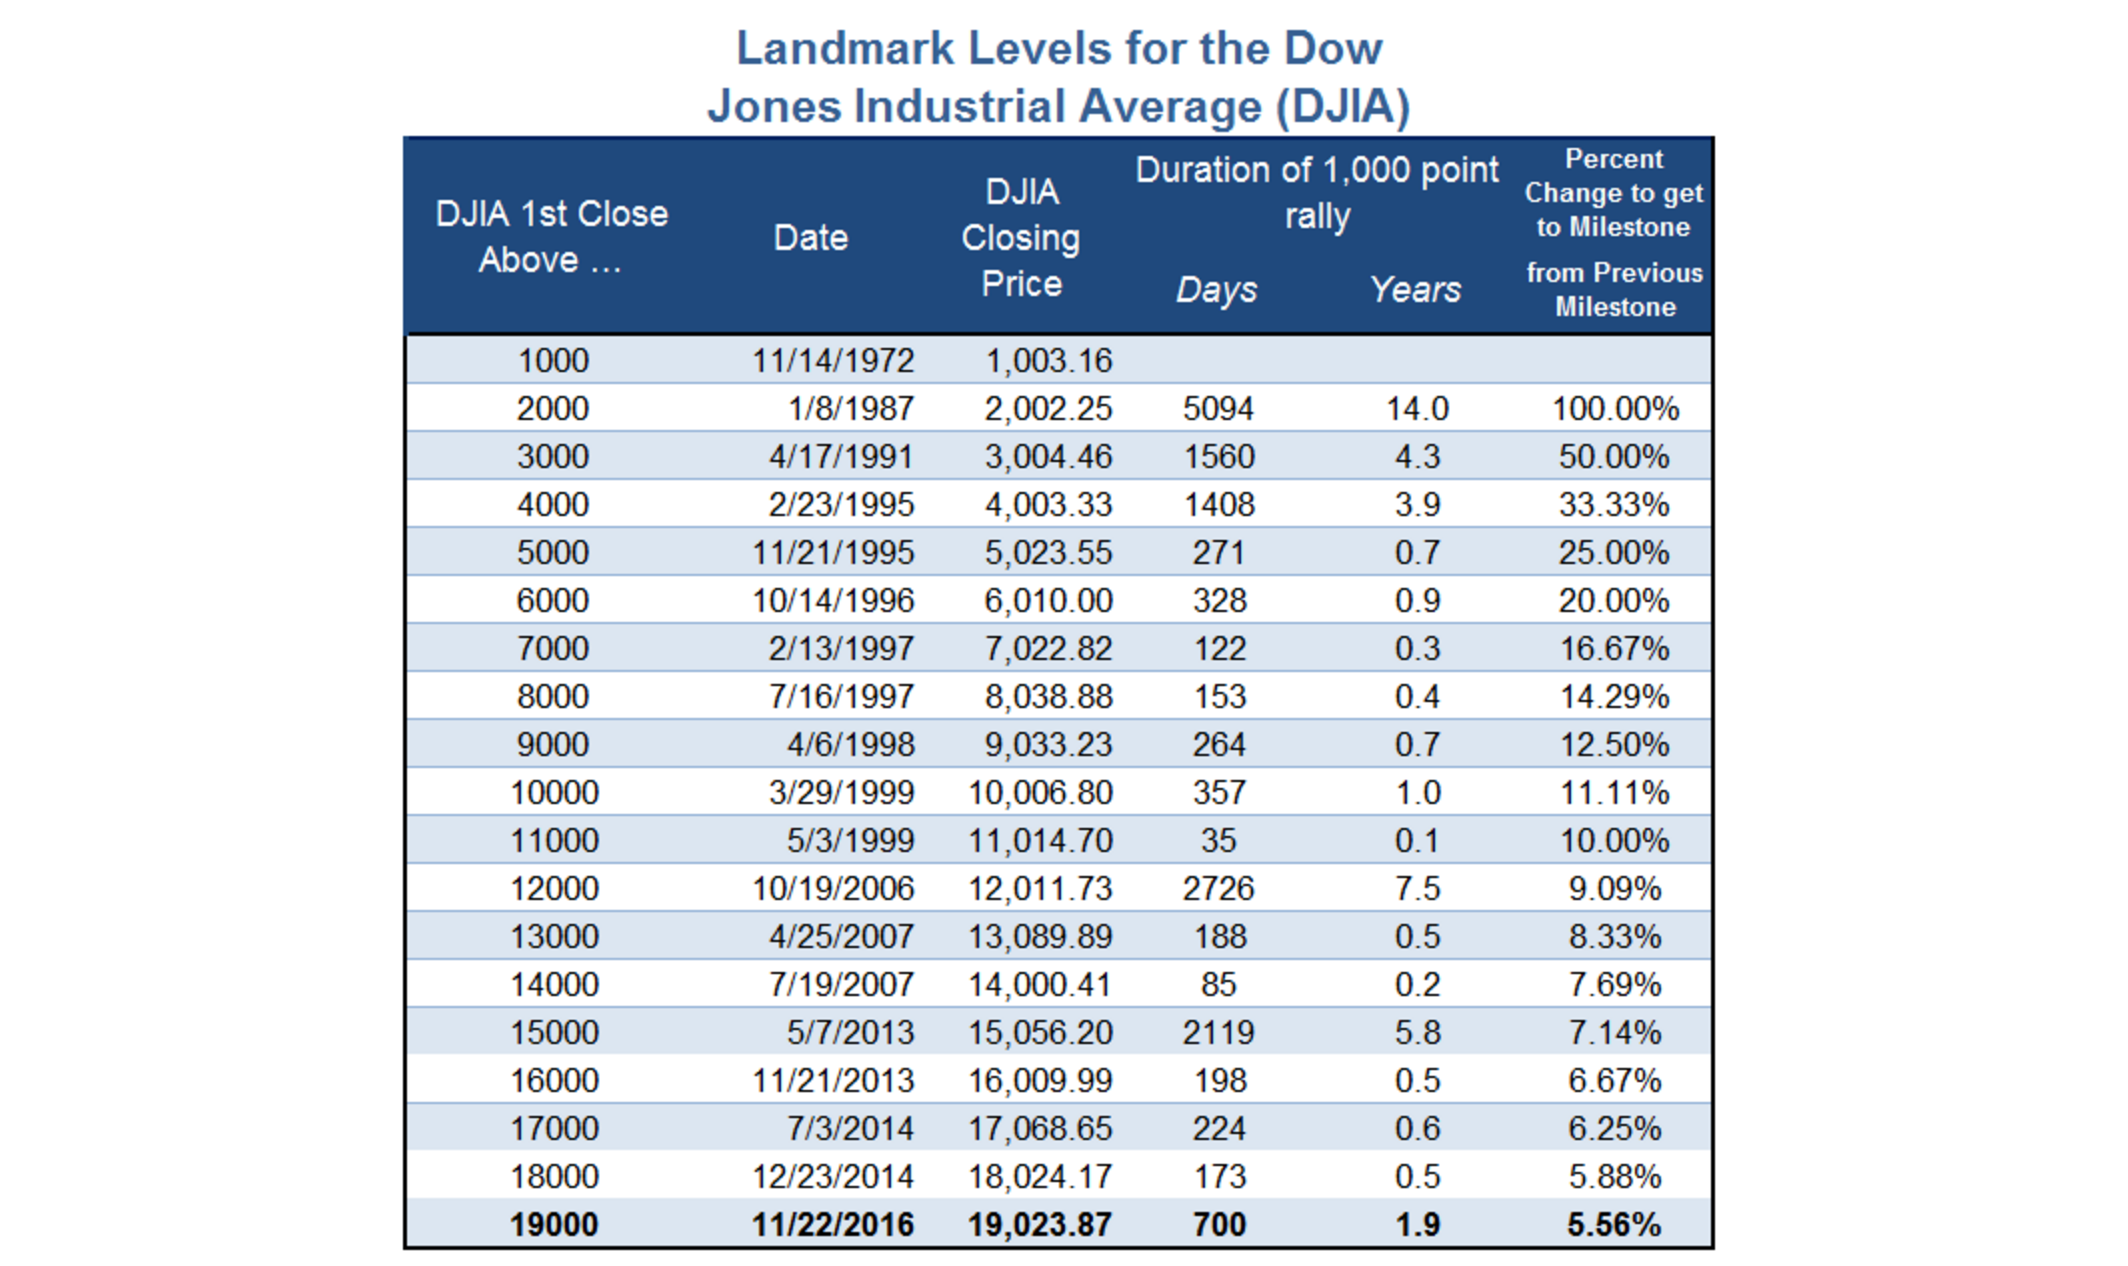
Another thing I’m hearing bubbling up is people worried about the market both being at an all-time high (generally) and that the Dow is now trading through 19,000. Take a look at this chart, below. Each 1,000-point milestone for the Index is shown along with the date the move ensued, the number of days it took to rally from the previous milestone, and the percent move.
Notice how the “Percent Change to get to Milestone from Previous Milestone” is getting smaller and smaller? That should make sense but the real interesting thing is to also look at the number of days it took to hit the next milestone.

The Dow first closed above 18,000 in December of 2014. That means it took 700 days (close to two years) to rally the 5.56% percent change from 18,000 to 19,000. I know that seems like a long time for a relatively small return, but it’s actually right in line with the average duration for a 1,000-point rally in the Index.
If you go back to 1999 when the Index first closed above the 10,000 level, you’ll see the average length of each move was 680 days. The shortest duration of a 1,000-point rally was in 1999 when it took just 35 days for the Index to go from the 10,000 level to 11,000.
35 days! Remember 1999?! Phew…anyway…
The next 1,000 points was a long row to hoe and did not come quite so easily. It was also the longest period of time between two milestones – 7.5 years. The dates were May, 1999 to 12,000 in October, 2006.
My point is that you can’t really take anything away from markets hitting a high or milestones being reached. It’s like driving from D.C. to Miami and crossing a state line along the way. It’s a milestone, but really has nothing to do with the overall trip.
One last little tidbit – did you know that a during a penalty kick in soccer, the goal keeper has the best chance of stopping the shot by staying still and not diving left or right? Yup – here’s the study. They have a 33.3% chance of halting the shot if they stay in the center, a 14.2% on the left and 12.6% diving to the right. Interesting, because goalies only stand still 6.3% of the time.
It’s hard to do nothing, and the constant bombardment of news and data prey on our human brains. Like in soccer, the best thing when investing is to have a plan and do nothing even when you feel like you need to do something. It’s hard, I know, but don’t kid yourself that you always have to do something. Chances are doing nothing may be the smartest thing to do of all your options. Read about Private Wealth Planning
Politics
I’ll keep this simple and relevant to the market and economy. I believe that the 2018 mid-term races will be important to what happens over the next 2 years. Democrats (Dems) have to defend 25 seats and Republicans (Rs) have to only defend 8. 10 Dems are in states that Trump won. 5 of those states are where Trump won by more than 55%. See: “Our Quick Election Thoughts”
I think that will set the conditions for some good bargaining for the first time in a long time. I think the Dems will be more likely to cut a deal than slug it out given the 2018 election landscape. Tax reform is a lay-up, since both sides agree that there is a lot of room to improve the tax code. As I’ve said in previous blogs, lowering the corporate tax rate will increase earnings, plain and simple. Additionally, Treasury nominee Steven Mnuchin has made it clear he thinks there is room for major corporate tax reform.
I’m not taking side, I’m merely stating that the probability of tax reform is high and that’s going to be good for earnings.
The market is up because PEOPLE ARE HOPEFUL about the economy. Period.
That’s good for anyone who needs to grow their wealth for retirement.
Call with questions.
 Important Disclosure Information
Please remember that past performance may not be indicative of future results. Different types of investments involve varying degrees of risk, and there can be no assurance that the future performance of any specific investment, investment strategy, or product (including the investments and/or investment strategies recommended or undertaken by Monument Wealth Management), or any non-investment related content, made reference to directly or indirectly in this blog will be profitable, equal any corresponding indicated historical performance level(s), be suitable for your portfolio or individual situation, or prove successful. All indexes referenced are unmanaged and cannot be invested into directly. The economic forecasts set forth may not develop as predicted. Due to various factors, including changing market conditions and/or applicable laws, the content may no longer be reflective of current opinions or positions. Moreover, you should not assume that any discussion or information contained in this blog serves as the receipt of, or as a substitute for, personalized investment advice from Monument Wealth Management. To the extent that a reader has any questions regarding the applicability of any specific issue discussed above to his/her individual situation, he/she is encouraged to consult with the professional advisor of his/her choosing. Monument Wealth Management is neither a law firm nor a certified public accounting firm and no portion of the blog content should be construed as legal or accounting advice. A copy of Monument Wealth Management’s current written disclosure statement discussing our advisory services and fees is available for review upon request.


