This week, I review the markets, the recent GDP report and earnings. All with my general dose of jokes and sarcasm intertwined with facts and general advice. Just like the doctor ordered.
We are currently working on our quarterly video – be on the look-out for that. In case you are curious, you can re-watch the January video here.
Also, be sure to see the press release on Brittany and I presenting at the Barron’s Top Independent Advisors Summit last month. It is an honor to be asked to present to a collection of the finest people in the business.
The markets last week were all losers. It’s interesting to see how the different markets have done so far in 2016. Here’s how the year to date (YTD) returns look based on my current FactSet screen at 11:45am today:
- Dow Jones Industrial Average (DJIA): +2.50%
- S&P 500: +1.50%
- Russell 2000: -0.30%
- NASDAQ: -4.50
What I see is that the large value names in the DJIA are doing well, and in general, large cap is doing better than small cap YTD. Since the S&P 500 has 500 stocks versus 30 in the DJIA, we can see that the small cap underperformance for the year is impeding the S&P 500. Take a look at the negative Russell 2000 YTD return, which is a good pointer as to why the DJIA is outperforming the S&P 500…it’s the small caps.
…Which remember have come roaring back. Snapshots in time are tough. It’s like being on a road trip from DC to Miami and looking at your speedometer at each state line. It’s kind of irrelevant, but it’s a milestone. I write about it here.
Tech has been crushed. It’s down around -4.5%. Last week this index was down -3.0%. Ouch. Poor earnings from big tech companies like Microsoft, Apple and Google (Alphabet…whatever) really hit the whole tech sector hard.
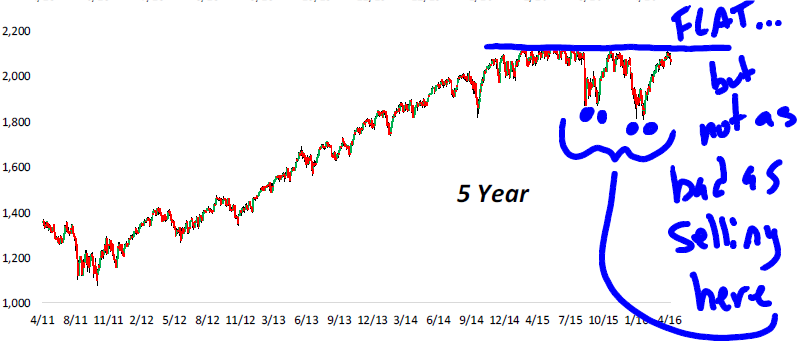
Here’s a chart with my sarcasm penned in.

(Chart: Bespoke)
I recently wrote about the markets being much more flat than most people realize for a longer period of time than most people realize.
I get it, no one likes to have to ask, “Why isn’t my portfolio making money?” and I certainly hate having to answer it with, “Well, a major factor is that the markets are flat.”
The hardest part of doing what we do is keeping people from making big mistakes. So while flat sucks, having to dig out of a hole made by a mistake is even worst – and believe me when I tell you the investing landscape is littered with people having made this mistake. The thing I’ll hang our hat on is that throughout (and after) those dips, we maintained that we did not see anything signaling a recession and that our feeling was that they were panicked sell-offs.
As the markets digested the fear and the recession data never materialized, the market recovered. THIS IS WHY UNLESS YOU NEED CASH, YOU SHOULDN’T DO ANYTHING DURING THESE SELL-OFFS.
If you made this mistake, it’s okay. It can be fixed and there is something to be learned from it. Please call us if this applies to you, we can help.
GDP Came Out Last Week
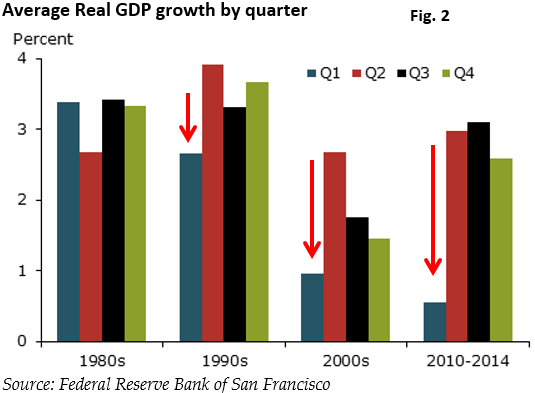
Everyone who has not been living under a rock knows that the year started out with a lot of worry that the economy was doing poorly. We always maintained that while economic growth was tepid at best, growth is still growth and that’s a lot different than an actual shrinking economy. By the way, we have previously seen Q1 GDP reports slightly negative and it has not resulted in any outright recession.
On to the Q1 report. Last week’s GDP report showed that the economy rose at an annual pace of 0.5%. This was down from Q4 2015’s pace of 1.4%.
The data are reflecting that there was a slowdown in consumer spending, a very large drop in business investment (the largest since the recession) and a decline in exports.
As for consumer spending and exports, it looks like over Q1 we saw a cautious consumer and a slow-moving global economy, which impacted goods being sold overseas.
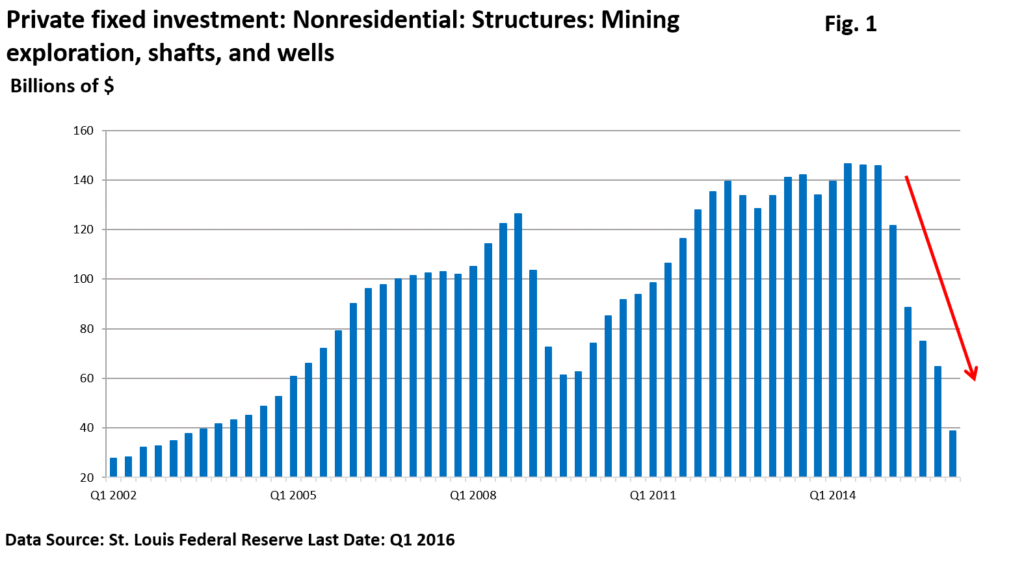
As for the business investment, it was all about oil. Oil exploration and all of the associated industries around that require huge amounts of capital to be invested. That should make sense, since you need to buy a lot of stuff to do all that oil exploration, pumping, etc. It’s hard to invest (business investment) when you are not making any money off of the oil you are pumping out of the ground. AND no one wants to lend you money – it’s like telling a bank you lost your job and want a new mortgage.
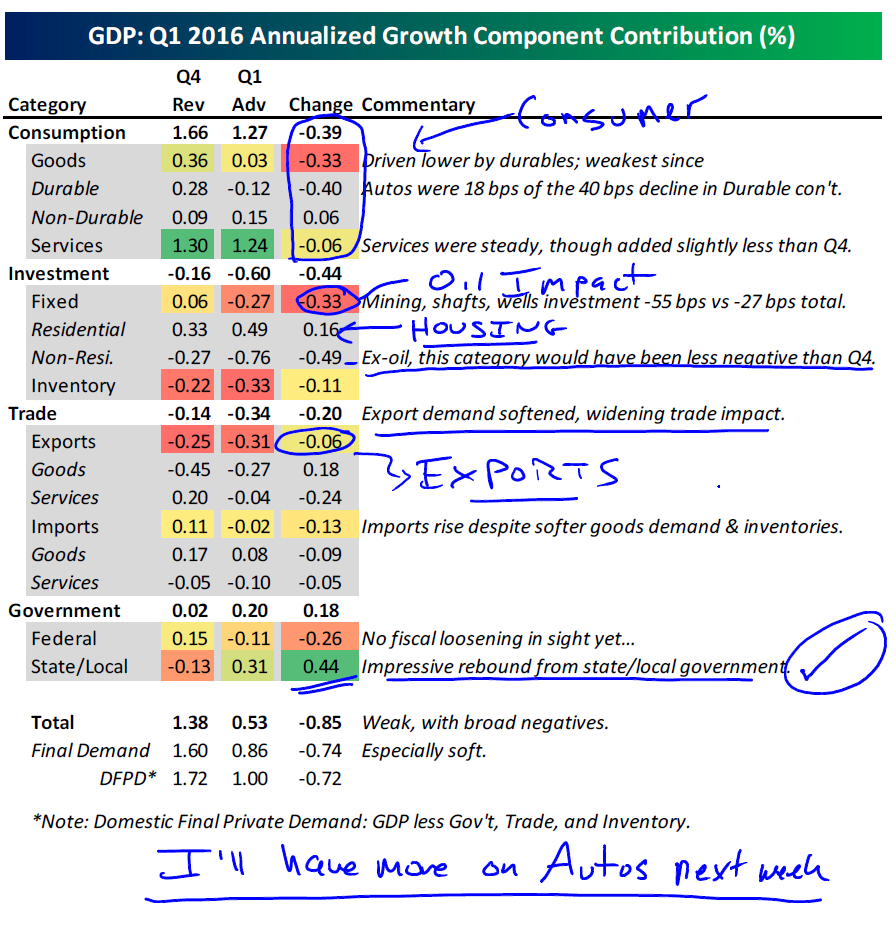
(Chart Source: Bespoke. Handwriting – me)
I know this is where I may start losing people, BUT, you can see in the chart below that there is a sharp drop in the oil rig count that has lopped over $100 billion from GDP in a little over one year.
That’s a big drop in business investment.
Moreover, cutbacks in energy ripple throughout the manufacturing supply chain (i.e. the associated industries I mentioned before).
(Chart Source: Charles Sherry)
There is still a lot of speculation that seasonal quirks are playing a part in weak Q1 readings. See the chart below which shows the Q1 data over the decades…since 1990, growth in the first quarter has been unusually weak.
(Chart Source: Charles Sherry)
Let’s just wait to see what happens, like we have over the past few Q1 GDP reports. There is no denying that there is good strength in the labor market and this makes people speculate that business activity may not have slowed as much as the GDP report suggested.
If that’s the case, we may get a bounce in activity in Q2.
Earnings
As of Friday, there have about 1,100 companies who have reported.
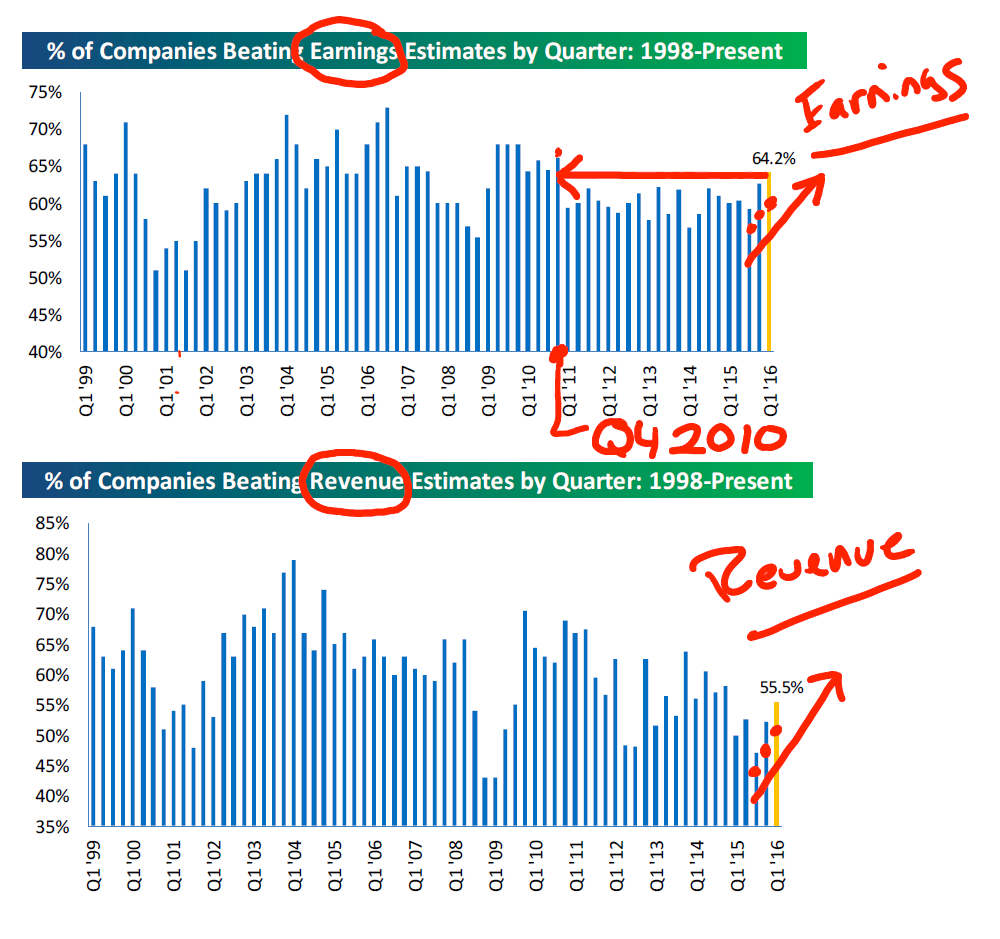
Companies beating their revenue forecasts stand at 55.5%, which is currently higher than the final number for fourth quarter, 2015 (Q4 2015). Companies beating their earnings estimates stands at 64.2%, which is higher than the Q4 2015 final number of 63%. While it is currently only a little higher than the Q4 2015 number, it is the highest reading seen in five years, going back to Q4 2010.
(Chart Source: Bespoke. Handwriting – me)
Have a great week – call with questions.

Important Disclosure Information for “A Review of First Quarter GDP”
Please remember that past performance may not be indicative of future results. Different types of investments involve varying degrees of risk, and there can be no assurance that the future performance of any specific investment, investment strategy, or product (including the investments and/or investment strategies recommended or undertaken by Monument Wealth Management), or any non-investment related content, made reference to directly or indirectly in this blog will be profitable, equal any corresponding indicated historical performance level(s), be suitable for your portfolio or individual situation, or prove successful. All indexes referenced are unmanaged and cannot be invested into directly. The economic forecasts set forth may not develop as predicted. Due to various factors, including changing market conditions and/or applicable laws, the content may no longer be reflective of current opinions or positions. Moreover, you should not assume that any discussion or information contained in this blog serves as the receipt of, or as a substitute for, personalized investment advice from Monument Wealth Management. To the extent that a reader has any questions regarding the applicability of any specific issue discussed above to his/her individual situation, he/she is encouraged to consult with the professional advisor of his/her choosing. Monument Wealth Management is neither a law firm nor a certified public accounting firm and no portion of the blog content should be construed as legal or accounting advice. A copy of Monument Wealth Management’s current written disclosure statement discussing our advisory services and fees is available for review upon request.
