It Was a Heck of a Week for Equity Markets and Records

In case you didn’t see our announcement last week, Monument Wealth Management was once again recognized as one of the Best Places to Work in the Washington D.C. area for the third year in a row. It was a heck of a week for equity markets and records. After a crushing blow at the end of the previous week, U.S. stock indexes rallied last Monday with the often cited Dow climbing 208 points, the index’s strongest daily result of the week. The S&P 500 surpassed its previous high last week which was set two months ago and the NASDAQ reached its highest level since March 10, 2000, which is often referred to as the peak of the dot-com boom.
There was another milestone last week out of Japan. Japan’s Nikkei Stock Average closed above 20,000 on Thursday for the first time in 15 years, however the index remains far below its record level of 38,915 which it reached in December of 1989.
Strong earnings from information technology companies provided the lift throughout the week in the equity markets. Amazon, Google, and Microsoft were on fire Friday after those companies reported their quarterly results. Amazon was the biggest gainer.
Crappy Growth
So here’s the deal. With slow growth and some pretty mediocre economic reports (meaning nothing catastrophic and nothing really earth shattering in the reports) a huge question on everyone’s mind is, “Why is the equity rally so strong in the middle of such a weak recovery?” Bespoke had a note out last week that highlighted the length of the current bull run. They reported that it has been 1251 days without a 10% correction in the S&P 500, while on average there is usually at least a 10% pullback in the market every calendar year. So the point is that while a lot of people may be saying we are due for a pullback, using the “one pullback per year” logic, we have probably been due for one since the end of 2012.
For the record, the longest time the S&P 500 went without a 10% pullback was 2553 days during the 1990s tech boom that was driven by a much stronger economy.
The difference now is that the current six-year rally is being driven by low wage growth (companies are not having to pay employees a lot more money year over year) which is helping to increase corporate earnings. There is also a lot of cash making its way into the equity market.
The problem (if there is one / if there will be one) is that we can’t continue to have equity prices advance on weak growth forever. The U.S. equity market is the strongest major market in this post-2008 meltdown cycle so far and it is facing falling corporate profit margins. If growth continues to disappoint for much longer (and much longer means MUCH LONGER), then a deflation outlook risks setting in. In Japan, that environment crushed equity returns for two decades.
What does that mean for you, the investor?
Not much right now but I think it really has to factor into the timeline that the Fed has for raising interest rates. If there is slow growth and no inflation, why would they be in a rush to begin to implement a rate hike? Of course I provide a cheat sheet to timing the rate hike in this blog.
Also, if the equity markets have been in a bull market for this long and over 1251 days without a 10% pullback on crappy growth, imagine what will happen when there is some growth AND some of the gas savings stops filling savings accounts and start to be spent in the economy.
Here’s a quote from my blog on April 6th
“I think we’ll see the U.S. economy return to a sturdier course of growth over the next six months as weather improves. Oh, and let’s not forget that lower oil is a massive source of stimulus for the U.S. and other economies around the world.
We are in the pro-growth camp. While equity investing may seem challenging RIGHT NOW, we feel that looking farther down the road, there is a lot more pointing to growth than contraction. Interest rates will rise and bonds will not do well. That’s not only my opinion but it’s pretty well grounded in academics as well. Will volatility be high? Sure. Especially given the impending rate hikes and the cloudy short-term corporate earnings picture. If you need money to buy something over the next twelve months, raising cash and sitting on it is not a bad strategy.”
Growth over value and small and mid-caps over large-caps should continue to be your play in this cycle. I know it has been a broken record of advice and people ask me all the time, “Do you have any new ideas?” The answer is honestly, “No.” But what’s changed over the past 1251 days? We continue to have slow growth, low expected earnings, low inflation, and low interest rates. Until something really changes, anyone with a good idea probably has more of an itchy trigger finger problem than anything else.
Greece
Do you want to know why the markets don’t seem to care much about Greece? Because no one believes that there will be an adverse outcome there. How’s that for riveting analysis? But I think it’s as simple as that.
Earning Season
Earnings season is in swing and just about 400 companies have reported their earnings and revenue for the fourth quarter (1Q) of 2015. According to Bespoke, here’s how we look:
The percentage of companies beating their revenue estimates for the 1Q of 2015 stands at 52.3%, which is currently below the average of 60% that we’ve seen since 200 and below the final 58.1% from the 4Q of 2014. Since the revenue readings bottomed out in the 4Q of 2011, quarter-over-quarter readings have ping-ponged but the trend has been positive for revenues. We will see how things end up.
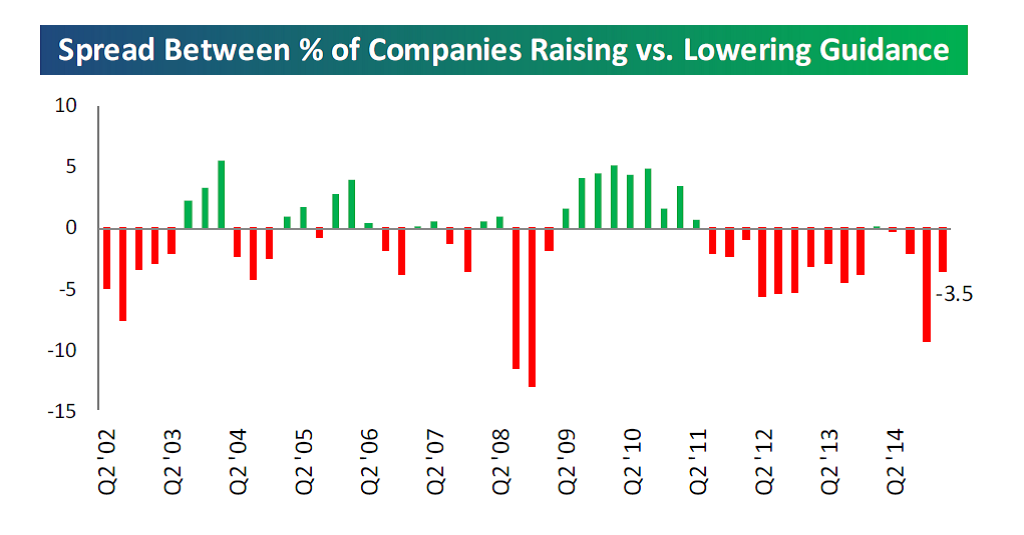
The percentage of companies beating their earnings estimates stands at 66.5%, which is well above the average of 62% dating back to 1998, and the 61.1% final reading from the 4Q of 2014. Bespoke also publishes a chart that shows the spread between companies guiding future earnings higher or lower on a percentage basis. Up until the 1Q of 2014, the spread had been negative for the TEN previous quarters, meaning there are more companies stating they will earn less in the upcoming quarter than the same quarter a year prior. That’s 2.5 years of pessimism coming out of corporate America.
After two flat quarters in the 1Q and 2Q of 2014, we saw the 3Q of 2014 revert back to a negative reading. The final reading for the 4Q of 2014 shows that the spread between companies posting negative guidance versus companies posting positive guidance in the 4Q was a whopping -9.4%! This was the worst spread reading since the last two quarters of 2008. The current reading stands at -3.5%, which even though it is a negative reading, it’s a huge improvement from the 4Q reading of -9.4%. Here’s the chart from Bespoke.
As for earnings, here’s my thought… 66.5% is a pretty large number compared to the readings we have seen over the past four years. Earnings have been beating expectations, but those expectations have been massively lowered over the past month or so. Especially in the Energy sector. When the bar is laying on the floor, it’s pretty easy to clear.
Please call with questions.

Important Disclosure Information for “It Was a Heck of a Week for Equity Markets and Records”
Please remember that past performance may not be indicative of future results. Different types of investments involve varying degrees of risk, and there can be no assurance that the future performance of any specific investment, investment strategy, or product (including the investments and/or investment strategies recommended or undertaken by Monument Wealth Management), or any non-investment related content, made reference to directly or indirectly in this blog will be profitable, equal any corresponding indicated historical performance level(s), be suitable for your portfolio or individual situation, or prove successful. Due to various factors, including changing market conditions and/or applicable laws, the content may no longer be reflective of current opinions or positions. Moreover, you should not assume that any discussion or information contained in this blog serves as the receipt of, or as a substitute for, personalized investment advice from Monument Wealth Management. To the extent that a reader has any questions regarding the applicability of any specific issue discussed above to his/her individual situation, he/she is encouraged to consult with the professional advisor of his/her choosing. Monument Wealth Management is neither a law firm nor a certified public accounting firm and no portion of the blog content should be construed as legal or accounting advice. A copy of Monument Wealth Management’s current written disclosure statement discussing our advisory services and fees is available for review upon request.

David B. Armstrong, CFA
President & Co-Founder
Dave got into the industry when he discovered his passion for finance in his mid-20’s. He’s a combat veteran and served as an officer in the United States Marines Corps on both active duty and in the reserves, retiring at the rank of Lieutenant Colonel. While serving on active duty, Dave was unable to spend money on deployments, so he became a self-taught investor. Along with a few bucks cash as a bouncer, his investing performance grew to be good....
IMPORTANT DISCLOSURE INFORMATION
Please remember that past performance is no guarantee of future results. Different types of investments involve varying degrees of risk, and there can be no assurance that the future performance of any specific investment, investment strategy, or product (including the investments and/or investment strategies recommended or undertaken by Monument Capital Management, LLC [“Monument”]), or any non-investment related content, made reference to directly or indirectly in this blog will be profitable, equal any corresponding indicated historical performance level(s), be suitable for your portfolio or individual situation, or prove successful. Due to various factors, including changing market conditions and/or applicable laws, the content may no longer be reflective of current opinions or positions. Moreover, you should not assume that any discussion or information contained in this blog serves as the receipt of, or as a substitute for, personalized investment advice from Monument. To the extent that a reader has any questions regarding the applicability of any specific issue discussed above to his/her individual situation, he/she is encouraged to consult with the professional advisor of his/her choosing. No amount of prior experience or success should be construed that a certain level of results or satisfaction will be achieved if Monument is engaged, or continues to be engaged, to provide investment advisory services. Monument is neither a law firm nor a certified public accounting firm and no portion of the blog content should be construed as legal or accounting advice.
A copy of Monument’s current written disclosure Brochure discussing our advisory services and fees is available for review upon request or at www.monumentwealthmanagement.com/disclosures. Please Note: Monument does not make any representations or warranties as to the accuracy, timeliness, suitability, completeness, or relevance of any information prepared by any unaffiliated third party, whether linked to Monument’s website or blog or incorporated herein, and takes no responsibility for any such content. All such information is provided solely for convenience purposes only and all users thereof should be guided accordingly.
Historical performance results for investment indices, benchmarks, and/or categories have been provided for general informational/comparison purposes only, and generally do not reflect the deduction of transaction and/or custodial charges, the deduction of an investment management fee, nor the impact of taxes, the incurrence of which would have the effect of decreasing historical performance results. It should not be assumed that your Monument account holdings correspond directly to any comparative indices or categories. Please Also Note: (1) performance results do not reflect the impact of taxes; (2) comparative benchmarks/indices may be more or less volatile than your Monument accounts; and, (3) a description of each comparative benchmark/index is available upon request.
Please Remember: If you are a Monument client, please contact Monument, in writing, if there are any changes in your personal/financial situation or investment objectives for the purpose of reviewing/evaluating/revising our previous recommendations and/or services, or if you would like to impose, add, or to modify any reasonable restrictions to our investment advisory services. Unless, and until, you notify us, in writing, to the contrary, we shall continue to provide services as we do currently. Please Also Remember to advise us if you have not been receiving account statements (at least quarterly) from the account custodian.