The Market Continues to Be Hated After a Great Month
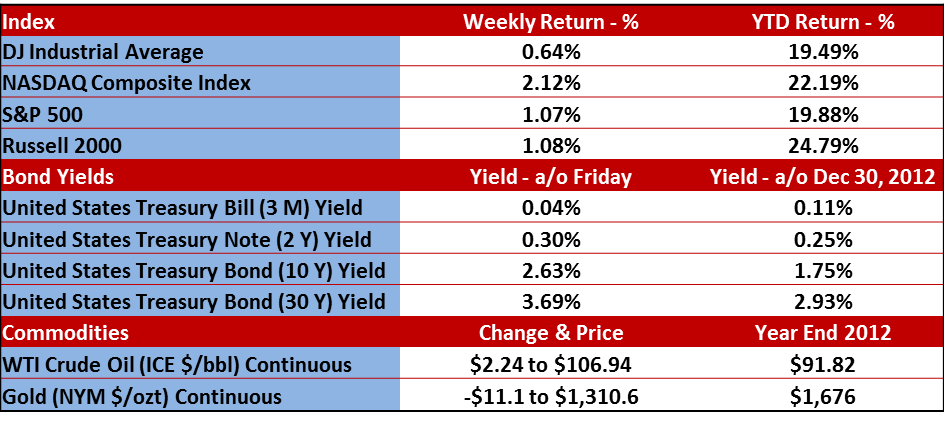
July was a good month for the markets, especially for the summer. The Dow Jones Industrial Average (DJIA), the Standard & Poor’s 500 (S&P 500) and the NASDAQ were all up 4.0%, 4.95% and 6.6% respectively for the entire month. In fact, the DJIA and the S&P 500 both hit new all-time highs and July was their second best month of 2013. The NASDAQ posted its best month of the year in July. The S&P 500 traded above 1700 for the first time but what is really significant is that 1700 is well above the two previous highs that were recorded in 2000 and 2007.
News flash for the haters – this is a bull market and there is a lot of momentum.
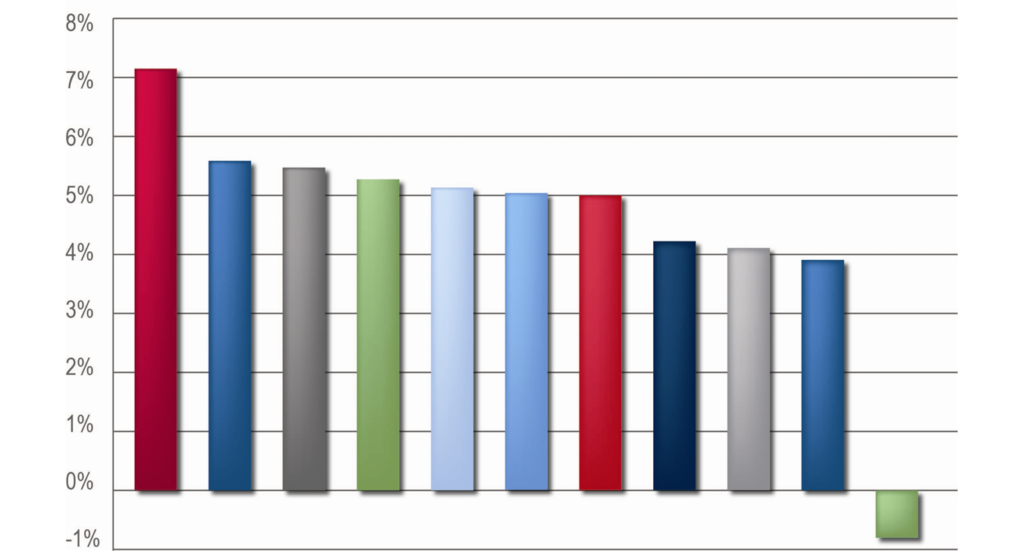
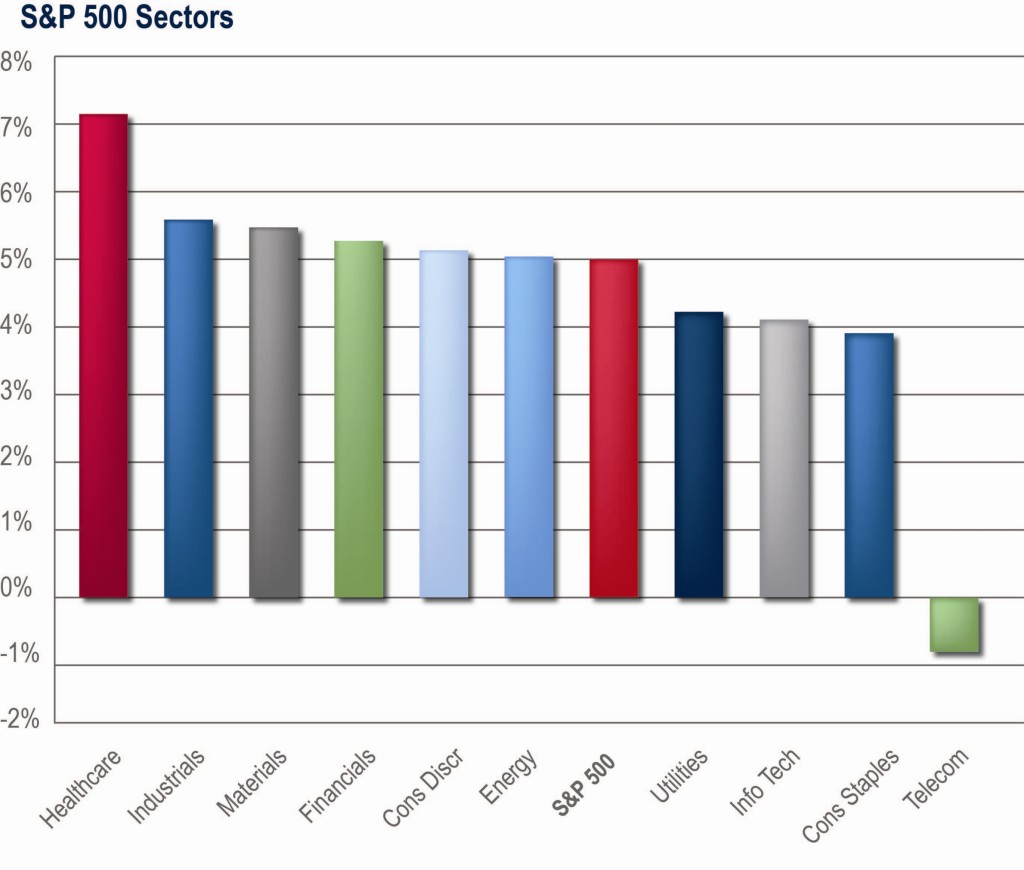
Nine of the ten S&P 500 sectors were positive for the month with Telecom being the only loser. Also, when compared to the 4.95% return on the S&P 500, six of the ten sectors outperformed the index. Healthcare was the overall winner with a 7.1% return, followed by Industrials (5.6% and an MWM favored sector), Materials (5.5%), Financials (5.3%), Consumer Discretionary (5.1% and an MWM favored sector) and Energy (5.0%). Still positive but trailing the S&P 500 for the month were Utilities (4.2%), Technology (4.1% and an MWM favored sector) and Consumer Staples (3.9%). Telecom was down -0.74%.
After the three big reports from last week (second quarter GDP, the jobs report and the Fed’s statement after their meeting), here’s a recap of how the market did last week.
Gross Domestic Product
The report was all over the news and while the first reading for second quarter GDP beat the estimated 1.1% and came in at 1.7%, the first quarter was revised from 1.7% down to 1.1%.
That’s essentially a break-even and the economy keeps trudging along with four of the past five quarters expanding at less than 2%. The good news is that the reports are not flashing any signs of a recession.
But what didn’t really hit the news was that an interesting adjustment was made. The Bureau of Economic Analysis revised GDP going all the way back to 1929 in order to incorporate categories such as research and development and intellectual property. In doing so, the annual pace of growth between 1929 and 2012 was revised up 0.1% from 3.2% to 3.3%.
Big deal, right?
But when you look at the data that was revised between the years of 2009 and 2012, average real GDP was revised up 0.3% from 2.1% to 2.4%
That’s a bigger deal.
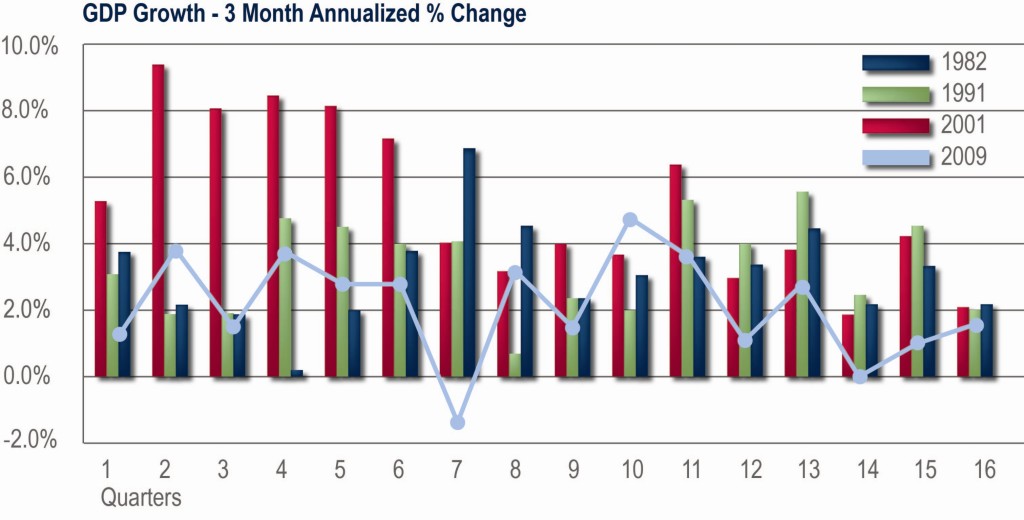
But then there are the comparisons to the past recessions and recoveries (1982, 1991, 2001 and current). Looking at the chart below, you can see that the current recovery is weaker than the past three, and this is showing up in the current high unemployment reading and weak jobs market.
Jobs Report
Jobs are tied to growth in the economy. There’s your Macro Econ Class in a nutshell. With no real substantial growth in GDP, the jobs outlook will remain muted and only improve at the same rate as the economy. So while it was disappointing that the Jobs Report (non-farm payroll) came in below expectations last week (reporting 166,000 new jobs vs. an expected 188,000 expected), the slow growing economy IS actually creating new jobs. The problem is that they are a lot of lower paying jobs in the retail and leisure/hospitality sector.
This number will see two more revisions, but it’s below the 193,000 average over the trailing twelve months. The unemployment rate ticked down 0.2% to 7.4%
The Fed
There was a lot of blah, blah, blah in the statement (wait, you didn’t just say that about my blog did you?) so here’s what you need to know.
They did not make any changes to the 6.5% threshold for the unemployment rate they are using as a benchmark to move the federal funds rate up from near zero. So for now, until we see 6.5% or lower unemployment, we will see 0% fed fund rates.
As for the tapering of bond purchases, most are speculating that there is a good chance they announce a slowdown in purchases at the September 17-18 meeting, but there were no hints at a taper in last week’s statement.
Of course that could all change based on economic data between now and then.
And while these last two pieces of data are a little misplaced here, it’s worth mentioning that the July ISM Manufacturing report came in last week with a reading of 55.4, up from 50.9. Remember, any reading above 50 is growth. This is the largest month-over-month jump since 1996… 17 years ago. AND the year-over-year increase in Ford F-150 pickup trucks for July was +22% and Ford has sold 428,000 of them this year. That’s the largest total through July since 496,000 were sold in 2006. Why are Ford F-150 sales so important? Well, only about 5% of them are sold to people who just want a pickup truck while 95% are sold to people who NEED a truck for work, like builders. Anyone care to remember how many houses were being built in 2006?
These truck sales are a great piece of news and the increase in Manufacturing growth is kind of a big deal.
Finally – Earnings Update
Last week, I wrote that the ratio of companies posting negative guidance went negative against the companies posting positive guidance. The reading this week has improved from a -3.20% last week to a -2.40% this week. With 75% of the companies already reported, it looks like we will probably see an 8th quarter in a row of a negative spread between companies raising vs. lowering guidance.
On a good note, the percentage of companies beating their revenue estimate for the 2nd quarter of 2013 is at 57.1% which is an improvement over last week and much better than last quarter. The percentage of companies beating their earnings estimates ticked down very slightly last week but is still a very nice reading at 64.9%. If that sticks, it will be the highest percentage of companies beating earnings estimates since the 4th quarter of 2010.
Tech companies are doing the best with 72.6% of companies reporting beating their earnings estimates while Telecom replaced Utilities as last place with only 40% beating earnings. (Data: Bespoke Investment Group)
Please call or email with questions.
Investment advice offered through Monument Advisory Group, LLC a Registered Investment Advisor (RIA). Securities offered through LPL Financial. Member FINRA/SIPC. Monument Advisory Group and Monument Wealth Management are separate entities from LPL Financial.
The opinions voiced in this material are for general information only and are not intended to provide specific advice or recommendations for any individual. To determine which investment(s) may be appropriate for you, consult your financial advisor prior to investing. All performance referenced is historical and is no guarantee of future results. All indices are unmanaged and cannot be invested into directly. Stock investing involves risk including loss of principal. The Dow Jones Industrial Average is comprised of 30 stocks that are major factors in their industries, and widely held by individuals and institutional investors. The Standard & Poor’s 500 Stock Index (S&P 500) is an unmanaged capitalization weighted index of 500 stocks designed to measure performance of the broad domestic economy through changes in the aggregate market value of 500 stocks representing all major industries. The NASDAQ Composite Index measures all domestic and non-U.S. based common stocks listed on The NASDAQ Stock Market. The market value, the last sale price multiplied by total shares outstanding, is calculated throughout the trading day, and is related to the total value of the Index. The Russell 2000 Small Stock Index is an unmanaged index generally representative of the 2000 smallest companies in the Russell 3000 Index. The Russell 2000 is an unmanaged index generally comprised of companies with lower price-to-book ratios and lower forecasted growth values. The 2, 10 and 30 year Treasury is simply the yield at the close of the day.
(1) West Texas Intermediate crude spot price is as of end of week.
(2) London Bullion Market Association; gold fixing pricing at 3 p.m. London time.

David B. Armstrong, CFA
President & Co-Founder
Dave got into the industry when he discovered his passion for finance in his mid-20’s. He’s a combat veteran and served as an officer in the United States Marines Corps on both active duty and in the reserves, retiring at the rank of Lieutenant Colonel. While serving on active duty, Dave was unable to spend money on deployments, so he became a self-taught investor. Along with a few bucks cash as a bouncer, his investing performance grew to be good....
IMPORTANT DISCLOSURE INFORMATION
Please remember that past performance is no guarantee of future results. Different types of investments involve varying degrees of risk, and there can be no assurance that the future performance of any specific investment, investment strategy, or product (including the investments and/or investment strategies recommended or undertaken by Monument Capital Management, LLC [“Monument”]), or any non-investment related content, made reference to directly or indirectly in this blog will be profitable, equal any corresponding indicated historical performance level(s), be suitable for your portfolio or individual situation, or prove successful. Due to various factors, including changing market conditions and/or applicable laws, the content may no longer be reflective of current opinions or positions. Moreover, you should not assume that any discussion or information contained in this blog serves as the receipt of, or as a substitute for, personalized investment advice from Monument. To the extent that a reader has any questions regarding the applicability of any specific issue discussed above to his/her individual situation, he/she is encouraged to consult with the professional advisor of his/her choosing. No amount of prior experience or success should be construed that a certain level of results or satisfaction will be achieved if Monument is engaged, or continues to be engaged, to provide investment advisory services. Monument is neither a law firm nor a certified public accounting firm and no portion of the blog content should be construed as legal or accounting advice.
A copy of Monument’s current written disclosure Brochure discussing our advisory services and fees is available for review upon request or at www.monumentwealthmanagement.com/disclosures. Please Note: Monument does not make any representations or warranties as to the accuracy, timeliness, suitability, completeness, or relevance of any information prepared by any unaffiliated third party, whether linked to Monument’s website or blog or incorporated herein, and takes no responsibility for any such content. All such information is provided solely for convenience purposes only and all users thereof should be guided accordingly.
Historical performance results for investment indices, benchmarks, and/or categories have been provided for general informational/comparison purposes only, and generally do not reflect the deduction of transaction and/or custodial charges, the deduction of an investment management fee, nor the impact of taxes, the incurrence of which would have the effect of decreasing historical performance results. It should not be assumed that your Monument account holdings correspond directly to any comparative indices or categories. Please Also Note: (1) performance results do not reflect the impact of taxes; (2) comparative benchmarks/indices may be more or less volatile than your Monument accounts; and, (3) a description of each comparative benchmark/index is available upon request.
Please Remember: If you are a Monument client, please contact Monument, in writing, if there are any changes in your personal/financial situation or investment objectives for the purpose of reviewing/evaluating/revising our previous recommendations and/or services, or if you would like to impose, add, or to modify any reasonable restrictions to our investment advisory services. Unless, and until, you notify us, in writing, to the contrary, we shall continue to provide services as we do currently. Please Also Remember to advise us if you have not been receiving account statements (at least quarterly) from the account custodian.