Explore Our
“Off The Wall” Blog
Read our Private Wealth Advisory team’s unique thoughts on the markets and investing.
“How Will You Live John? Day by Day…” – Rambo II

It’s from the end of the movie when John Rambo walks off from Colonel Trautman after the POW rescue mission. It’s similar to the way everyone probably felt last week during the shutdown and debt ceiling talks. After all the posturing and bickering, the American people got a three month reprieve from all the Washington baloney (my apologies to baloney). What a bunch of BUNK! However, from the end of September until a deal was struck on October 16, the major indices all gained ground with the Standard and Poor’s 500 Index (S&P 500) and the Russell 2000 setting new record highs on the Thursday and Friday following the deal.
Washington D.C. Circus – Fold up the Tents, for now it’s over.
Like Rambo II, the sequel to the December, 2012, brinksmanship was less exciting and equally as predictable. Politicians took the markets and the nation to the brink before hammering out an agreement that ended the government shutdown and raised the debt ceiling. But was anyone surprised that a deal got hammered out? We weren’t and we’ve been encouraging readers to keep a focus on the long term by not trading the market. Unlike Rambo, this was real life. On the morning of October 16, Senate negotiators announced a compromise that easily passed the Senate that evening, followed by a vote in the House and a signature by the President.
So what did we get besides HOURS of riveting television and commentary? Here’s a summary:
- The deal keeps the federal government open at current spending levels until January 15.
- The debt ceiling will be raised through February 7.
- Lawmakers will also be required to craft a long-term budget plan by December 13.
- Senator Majority Leader, Harry Reid, said the committee to accomplish the task will be led by Senator Patty Murray, a Washington Democrat, Representative Paul Ryan, a Wisconsin Republican, and the 2012 Vice President candidate under Mitt Romney.
- It includes no major alterations to the 2010 health-care law, though it does include new procedures to verify the incomes for some folks receiving government health-insurance subsides.
- It does not include a provision granting federal agencies more flexibility to ease the effects of the sequester – which is the annual automatic budget cuts included in the 2011 budget deal.
- The next round of spending cuts (sequester) set for mid-January will bring annual spending levels down to $967 billion from $986 billion, largely through cuts to defense spending.
The short-term extension was ultimately well received. Though we experienced some short-term volatility in equity markets since the start of October, the major indices gained ground during the government shutdown (I’m using the dates from September 30, 2013, to October 16, 2013). The Dow Jones Industrial Average was up 1.61%, the S&P 500 index was up 2.38% and the Russell 2000 index was up 1.74%. Here’s a snapshot of how well the sectors did with a chart from Bespoke Investment Group. It is not surprising that the more defensive sectors did well but all were positive.

From our blog that was published at the onset of shutdown I wrote:
“I have no more of an idea about what will happen than Speaker Boehner does…so I’ll leave it at this: Our conviction is to stay invested unless your need for short-term liquidity has changed. The need for short-term liquidity should be the only reason an investor is selling right now. If you can’t sleep at night, your asset allocation does not accurately reflect your risk tolerance and you should call your advisor to update your long-term planning and allocations.”
One last helpful Bespoke chart (below) shows how the S&P 500, the NASDAQ and the Russell 2000 have all broken through their previous highs (reflected by the straight line). The Dow Jones Transportation Average is thrown in there too, but we don’t regularly write about that index.

It’s EARNINGS SEASON!
While it’s early in the season, there has been some reporting. As of last Friday, we’ve heard from 190 out of the more than 2,000 that will report. However, the real heavy reporting begins this week.
While it’s really a little too early to measure the ratio of companies posting negative guidance against the companies posting positive guidance, last quarter ended as the 8th quarter in a row of a negative spread for this ratio. We will be writing about it in upcoming blogs.
The percentage of companies beating their revenue estimate for the 3rd quarter of 2013 currently sits at 50.9%, which is much lower than the average of 60% since 2001. The percentage of companies beating their earnings estimates stands at 60.5%, which is lower than the final reading from the 2nd quarter.
Please call or email with questions.
Investment advice offered through Monument Advisory Group, LLC a Registered Investment Advisor (RIA). Securities offered through LPL Financial. Member FINRA/SIPC. Monument Advisory Group and Monument Wealth Management are separate entities from LPL Financial.
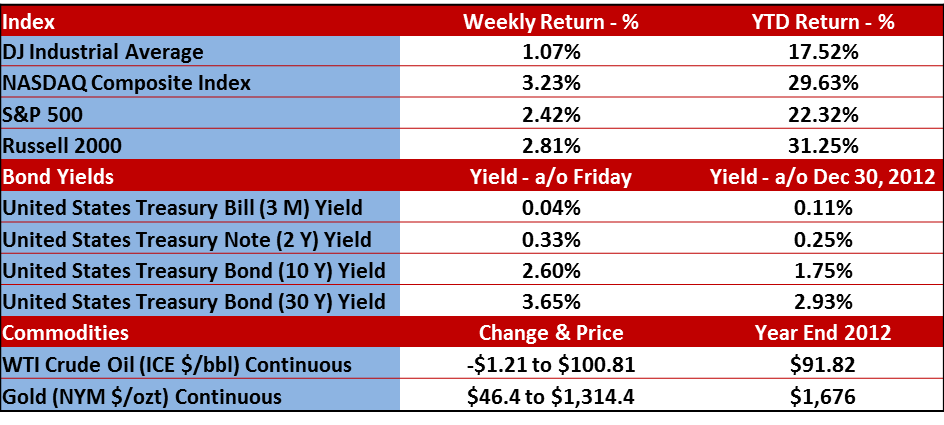
The opinions voiced in this material are for general information only and are not intended to provide specific advice or recommendations for any individual. To determine which investment(s) may be appropriate for you, consult your financial advisor prior to investing. All performance referenced is historical and is no guarantee of future results. All indices are unmanaged and cannot be invested into directly. Stock investing involves risk including loss of principal. The Dow Jones Industrial Average is comprised of 30 stocks that are major factors in their industries, and widely held by individuals and institutional investors. The Standard & Poor’s 500 Stock Index (S&P 500) is an unmanaged capitalization weighted index of 500 stocks designed to measure performance of the broad domestic economy through changes in the aggregate market value of 500 stocks representing all major industries. The NASDAQ Composite Index measures all domestic and non-U.S. based common stocks listed on The NASDAQ Stock Market. The market value, the last sale price multiplied by total shares outstanding, is calculated throughout the trading day, and is related to the total value of the Index. The Russell 2000 Small Stock Index is an unmanaged index generally representative of the 2000 smallest companies in the Russell 3000 Index. The Russell 2000 is an unmanaged index generally comprised of companies with lower price-to-book ratios and lower forecasted growth values. The 2, 10 and 30 year Treasury is simply the yield at the close of the day.
(1) West Texas Intermediate crude spot price is as of end of week.
(2) London Bullion Market Association; gold fixing pricing at 3 p.m. London time.

David B. Armstrong, CFA®
President & Co-Founder
Dave got into the industry when he discovered his passion for finance in his mid-20’s. He’s a combat veteran and served as an officer in the United States Marines Corps on both active duty and in the reserves, retiring at the rank of Lieutenant Colonel. While serving on active duty, Dave was unable to spend money on deployments, so he became a self-taught investor. Along with a few bucks cash as a bouncer, his investing performance grew to be good....
IMPORTANT DISCLOSURE INFORMATION
Please remember that past performance is no guarantee of future results. Different types of investments involve varying degrees of risk, and there can be no assurance that the future performance of any specific investment, investment strategy, or product (including the investments and/or investment strategies recommended or undertaken by Monument Capital Management, LLC [“Monument”]), or any non-investment related content, made reference to directly or indirectly in this blog will be profitable, equal any corresponding indicated historical performance level(s), be suitable for your portfolio or individual situation, or prove successful. Due to various factors, including changing market conditions and/or applicable laws, the content may no longer be reflective of current opinions or positions. Moreover, you should not assume that any discussion or information contained in this blog serves as the receipt of, or as a substitute for, personalized investment advice from Monument. To the extent that a reader has any questions regarding the applicability of any specific issue discussed above to his/her individual situation, he/she is encouraged to consult with the professional advisor of his/her choosing. No amount of prior experience or success should be construed that a certain level of results or satisfaction will be achieved if Monument is engaged, or continues to be engaged, to provide investment advisory services. Monument is neither a law firm nor a certified public accounting firm and no portion of the blog content should be construed as legal or accounting advice.
A copy of Monument’s current written disclosure Brochure discussing our advisory services and fees is available for review upon request or at www.monumentwealthmanagement.com/disclosures. Please Note: Monument does not make any representations or warranties as to the accuracy, timeliness, suitability, completeness, or relevance of any information prepared by any unaffiliated third party, whether linked to Monument’s website or blog or incorporated herein, and takes no responsibility for any such content. All such information is provided solely for convenience purposes only and all users thereof should be guided accordingly.
Historical performance results for investment indices, benchmarks, and/or categories have been provided for general informational/comparison purposes only, and generally do not reflect the deduction of transaction and/or custodial charges, the deduction of an investment management fee, nor the impact of taxes, the incurrence of which would have the effect of decreasing historical performance results. It should not be assumed that your Monument account holdings correspond directly to any comparative indices or categories. Please Also Note: (1) performance results do not reflect the impact of taxes; (2) comparative benchmarks/indices may be more or less volatile than your Monument accounts; and, (3) a description of each comparative benchmark/index is available upon request.
Please Remember: If you are a Monument client, please contact Monument, in writing, if there are any changes in your personal/financial situation or investment objectives for the purpose of reviewing/evaluating/revising our previous recommendations and/or services, or if you would like to impose, add, or to modify any reasonable restrictions to our investment advisory services. Unless, and until, you notify us, in writing, to the contrary, we shall continue to provide services as we do currently. Please Also Remember to advise us if you have not been receiving account statements (at least quarterly) from the account custodian.