If You Build It, They Will Come.

Well, I am referring to the general equity markets and not Healthcare.gov. Like the gentle reminder that Kathleen Sebelius was given in Tennessee on Friday (pic courtesy of The Daily News in Memphis), I’d like to remind investors about some stats regarding the equity markets over the past six months and thoughts about the remaining two.
I especially like the look on the face of the woman in red off to the right – I cannot tell if it is a look of horror or what, but she has a certain pucker factor look going on. Maybe she liquidated her equity holdings in December of 2012 to hedge against the Fiscal Cliff and just saw on a TV screen in the background how much the Dow Jones Industrial Average (DJIA), the Standard
and Poor’s 500 (S&P 500) and the Russell 2000 indices are all up year-to-date (YTD).
As we head into the final two months of the year, we do so with substantial gains year-to-date on all three indices we cover on a weekly basis. By the last trading day in October, the DJIA was up over 18%, the S&P 500 was up over 23% and the Russell 2000 was up over 29% (all YTD returns).
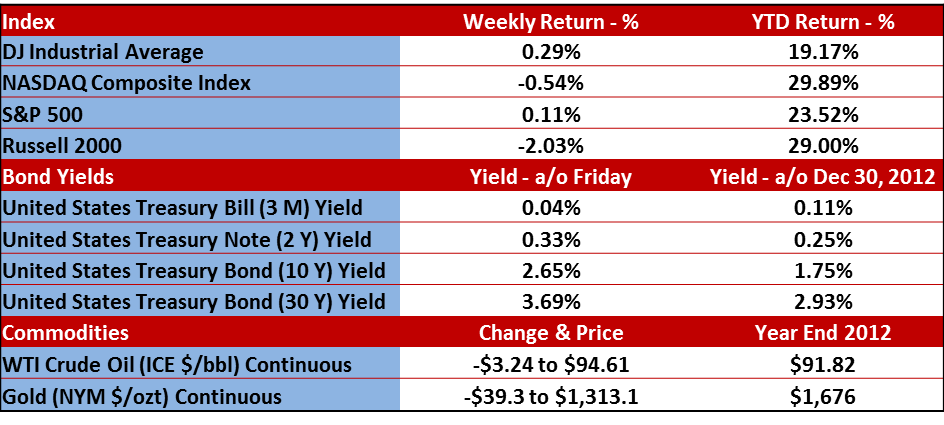
The DJIA is Lagging the Other Indices – Especially Over the Past Six Months.
The DJIA is a price-weighted index, meaning the stocks that have the highest price per share carry the most weight. As such, one has to look no further than to Big Blue, IBM. With a price per share of around $180, it carries a lot of weight in the DJIA. With IBM down almost -5% YTD (10/29/13) and down over -10% for the previous six months (4/30/13 – 10/29/13), that pretty much accounts for a lot of the reason the DJIA is not keeping up with the S&P 500 and the NASDAQ Composite indices. The disparity between the indices is really seen over the past six months, which is traditionally the weaker part of the market. The periods of November to April are considered the stronger part (per the yearly Stock Trader’s Almanac). The DJIA is up over 5.5% for the period of May to October this year. Not shabby, but the S&P 500 and the NASDAQ are both up 10.9% and 18.7% (WOW!!!) respectively.
Thanks Big Blue.
Economy & Earnings Season
The ISM manufacturing report came out last week and the reading came in at 56.4 vs. the
expected 55.0. We have not seen a reading of this level since August of 2011. It is also the fifth time in a row that the reading has exceeded expectation.
Last time that happened? 2009.
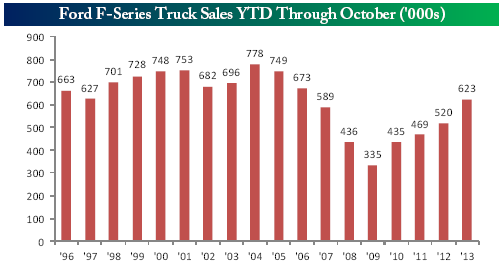
We love Bespoke Investment Group’s Ford F-150 Truck Sales graph they put out every month. Frequent readers know we have reported on this in the past. Basically, it’s a good sign when the sales are going up because most people buying F-150s are doing so as a small business. The below chart shows that 2013 has surpassed 2007 in YTD (through October) sales.
Nice.
Now On To Earnings.
The ratio of companies posting negative guidance against the companies posting positive guidance is currently at -5.0% and if that stays, it will be the ninth quarter in a row of a negative spread for this ratio. We will be writing about it in upcoming blogs.
The percentage of companies beating their revenue estimate for the third quarter of 2013 currently sits at 52.6% (vs. 54.4% last week), which is a move in the wrong direction and still lower than the average of 60% since 2001. The percentage of companies beating their earnings estimates stands at 61.5% (vs. 63.5% last week), which again is in the wrong direction is now lower than the final reading of 62.2 from the second quarter. With the exception of a quarterly setback in the first quarter of 2013, we have seen a nice steady quarter-over-quarter increase in earnings since the second quarter of 2012 so we hope this picks back up.
Please call or email with questions.
Investment advice offered through Monument Advisory Group, LLC a Registered Investment Advisor (RIA).
The opinions voiced in this material are for general information only and are not intended to provide specific advice or recommendations for any individual. To determine which investment(s) may be appropriate for you, consult your financial advisor prior to investing. All performance referenced is historical and is no guarantee of future results. All indices are unmanaged and cannot be invested into directly. Stock investing involves risk including loss of principal. The Dow Jones Industrial Average is comprised of 30 stocks that are major factors in their industries, and widely held by individuals and institutional investors. The Standard & Poor’s 500 Stock Index (S&P 500) is an unmanaged capitalization weighted index of 500 stocks designed to measure performance of the broad domestic economy through changes in the aggregate market value of 500 stocks representing all major industries. The NASDAQ Composite Index measures all domestic and non-U.S. based
common stocks listed on The NASDAQ Stock Market. The market value, the last sale price multiplied by total shares outstanding, is calculated throughout the trading day, and is related to the total value of the Index. The Russell 2000 Small Stock Index is an unmanaged index generally representative of the 2000 smallest companies in the Russell 3000 Index. The Russell 2000 is an unmanaged index generally comprised of companies with lower price-to-book ratios and lower forecasted growth values. The 2, 10 and 30 year Treasury is simply the yield at the close of the day.
(1) West Texas Intermediate crude spot price is as of end of week.
(2) London Bullion Market Association; gold fixing pricing at 3 p.m. London time.

David B. Armstrong, CFA
President & Co-Founder
Dave got into the industry when he discovered his passion for finance in his mid-20’s. He’s a combat veteran and served as an officer in the United States Marines Corps on both active duty and in the reserves, retiring at the rank of Lieutenant Colonel. While serving on active duty, Dave was unable to spend money on deployments, so he became a self-taught investor. Along with a few bucks cash as a bouncer, his investing performance grew to be good....
IMPORTANT DISCLOSURE INFORMATION
Please remember that past performance is no guarantee of future results. Different types of investments involve varying degrees of risk, and there can be no assurance that the future performance of any specific investment, investment strategy, or product (including the investments and/or investment strategies recommended or undertaken by Monument Capital Management, LLC [“Monument”]), or any non-investment related content, made reference to directly or indirectly in this blog will be profitable, equal any corresponding indicated historical performance level(s), be suitable for your portfolio or individual situation, or prove successful. Due to various factors, including changing market conditions and/or applicable laws, the content may no longer be reflective of current opinions or positions. Moreover, you should not assume that any discussion or information contained in this blog serves as the receipt of, or as a substitute for, personalized investment advice from Monument. To the extent that a reader has any questions regarding the applicability of any specific issue discussed above to his/her individual situation, he/she is encouraged to consult with the professional advisor of his/her choosing. No amount of prior experience or success should be construed that a certain level of results or satisfaction will be achieved if Monument is engaged, or continues to be engaged, to provide investment advisory services. Monument is neither a law firm nor a certified public accounting firm and no portion of the blog content should be construed as legal or accounting advice.
A copy of Monument’s current written disclosure Brochure discussing our advisory services and fees is available for review upon request or at www.monumentwealthmanagement.com/disclosures. Please Note: Monument does not make any representations or warranties as to the accuracy, timeliness, suitability, completeness, or relevance of any information prepared by any unaffiliated third party, whether linked to Monument’s website or blog or incorporated herein, and takes no responsibility for any such content. All such information is provided solely for convenience purposes only and all users thereof should be guided accordingly.
Historical performance results for investment indices, benchmarks, and/or categories have been provided for general informational/comparison purposes only, and generally do not reflect the deduction of transaction and/or custodial charges, the deduction of an investment management fee, nor the impact of taxes, the incurrence of which would have the effect of decreasing historical performance results. It should not be assumed that your Monument account holdings correspond directly to any comparative indices or categories. Please Also Note: (1) performance results do not reflect the impact of taxes; (2) comparative benchmarks/indices may be more or less volatile than your Monument accounts; and, (3) a description of each comparative benchmark/index is available upon request.
Please Remember: If you are a Monument client, please contact Monument, in writing, if there are any changes in your personal/financial situation or investment objectives for the purpose of reviewing/evaluating/revising our previous recommendations and/or services, or if you would like to impose, add, or to modify any reasonable restrictions to our investment advisory services. Unless, and until, you notify us, in writing, to the contrary, we shall continue to provide services as we do currently. Please Also Remember to advise us if you have not been receiving account statements (at least quarterly) from the account custodian.