Explore Our
“Off The Wall” Blog
Unique, straight-forward, unfiltered opinion on topics of concern for individuals with newfound wealth.
Recession Fears Seem to be Subsiding

I’ll admit it. I got nothing done this weekend since Season 4 of House of Cards was dumped onto Netflix. It broke the internet and my productivity like a dump truck full of Kim Kardashian derrière posts. So this may be a little short.
However, if this blog does not give you enough of a Monument fix, please be sure to see the great story written by Sara Gilgore at the Washington Business Journal which features Monument as a Cool Office in both an article and a video.
I’ve written several blogs since the beginning of the year highlighting the recession fears and the reasons that we felt they were overblown. For example, take a look at:
- Economic Review Video: January, 2016
- There is Definitely a Recession Coming
- Special Report – The Reason the Market is Down
- Why the Market is Whipsawing
Following February’s positive jobs report, we think it proves that our assessment of the situation was correct.
Last Friday, the U.S. Bureau of Labor Statistics reported nonfarm payrolls grew by 242,000 in February. That’s way better than the 190,000 new jobs that were expected.
Nice.
Wait, before I move on… both December and January figures were revised modestly higher, too. This means that more jobs were created in those months than previously thought.
Because Kevin Spacey and the re-emerging Neve Campbell (I have not seen her in anything since the 1997 block buster, “Wild Things.” Admit it – if you are a guy, you have watched it at least 18 times.) completely ruined my weekend, I have not yet read all the details of the jobs report. BUT, apparently, even though there were disappointing contents to the report, the jobs and data went a long way in subduing anxiety that the economy was drifting toward a recession.
I get it, and have said it before… It’s not like the economy is firing off like a SpaceX rocket, but tepid growth is better than no growth and in fact, IT IS GROWTH.
It also helps support the idea that falling commodity prices is more about excess supply and not a signal demand is faltering.
There has been a lot of talk about oil, stocks and high yield junk bonds. Let me try to explain.
First, I heard a great saying from an investor a few weeks ago at a dinner that I would like to share. He said, “Dave, there isn’t a stock market, only a market of stocks.” What he meant was that the stock market may be doing one thing but that is not what any particular market (or portfolio) of stocks is necessarily doing. (Thanks P, we look forward to a spring golf outing.)
This leads me to my next paragraph…
Our Asset Management Associate, Spencer Rand, came across an interesting “factoid,” as he called it. Carlyle Group pointed out that if you remove the ‘FANG” stocks (Facebook, Amazon, Netflix, Google), the annual return of the S&P 500 for 2015 drops from a positive 1.4% to a negative -2.8%. It’s not riveting analysis, but it’s significant. If you didn’t own these stocks last year, it will explain why you may have underperformed the S&P 500.
Looking for a gauge for how oil has impacted the general investor sentiment? Look no farther than the chart below from Charles Sherry.
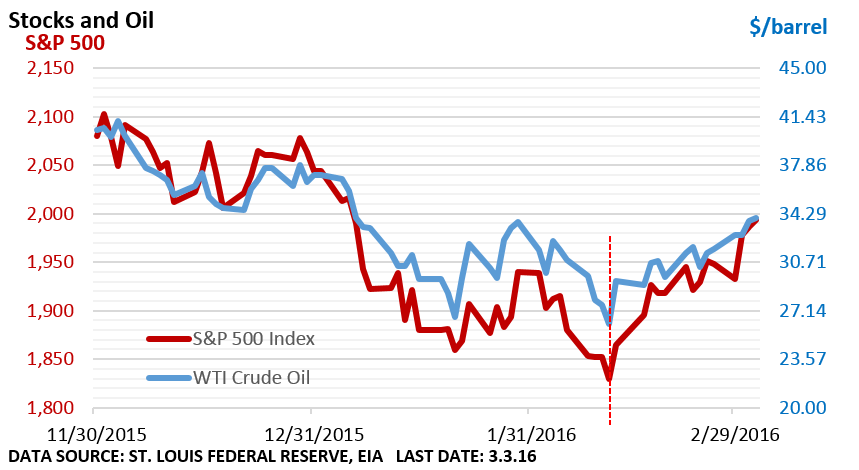
See the red line? It shows how the recent bottom in the S&P 500 Index corresponds with the recent bottom in oil prices.
Now for High Yield 101. Remember, there is an inverse relationship between the price of bonds ($) and their yield (%). When bond prices fall, their yields increase and vice versa. That’s as deep as I want to go on that for the purpose of explaining the below chart (also thanks Charles Sherry – you always put out great charts).
The left-hand side (brown line and numbers) is simply the difference between the average junk bond yield and yields on Treasury bonds of similar maturities. It’s often used as a measure of risk.
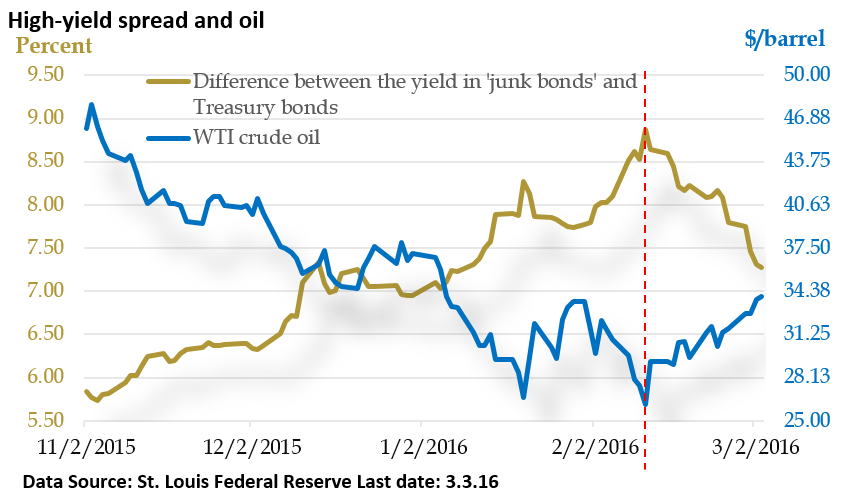
Note: The BofA Merrill Lynch US High Yield Master II Option-Adjusted Spread is the index for the left-hand side of the chart. It is an unmanaged index which cannot be invested into directly. Past performance does not guarantee future results.
A higher number means people are selling junk bonds (driving the yield higher because of the inverse relationship) and using that money to buy safer treasuries (driving the price up and yields down). That means people are trying to get safer with their money because they are scared. When the brown number is going down, it means people are selling treasuries and using the money to buy junk bonds, taking on more risk.
Once oil prices started falling, it created a perceived problem for junk bonds because investors got scared that the energy company junk bonds would default. But then when you take a look at the red line you see that the brown numbers started getting smaller at the same time that oil turned around…which means investors started to buy back into riskier debt.
In fact, Lipper reported U.S.-based junk bond inflows (a fancy way of saying that investors were buying back into the junk bonds) for the week ending on March 2nd were the highest on record (according to Reuters).
Basically, tighter credit conditions shown by the rising brown line can impede lending to businesses. This adds to anxiety and economic activity tends to stall.
However, the opposite is true too. If the spreads continue to compress, shown by a lowering brown line, it should be viewed as another positive sign for the economy.
Please call or email with questions. We are happy to answer them but will not spoil House of Cards for you…go watch it.

Important Disclosure Information for “Recession Fears Seem to be Subsiding “
Please remember that past performance may not be indicative of future results. Different types of investments involve varying degrees of risk, and there can be no assurance that the future performance of any specific investment, investment strategy, or product (including the investments and/or investment strategies recommended or undertaken by Monument Wealth Management), or any non-investment related content, made reference to directly or indirectly in this blog will be profitable, equal any corresponding indicated historical performance level(s), be suitable for your portfolio or individual situation, or prove successful. All indexes referenced are unmanaged and cannot be invested into directly. The economic forecasts set forth may not develop as predicted. Due to various factors, including changing market conditions and/or applicable laws, the content may no longer be reflective of current opinions or positions. Moreover, you should not assume that any discussion or information contained in this blog serves as the receipt of, or as a substitute for, personalized investment advice from Monument Wealth Management. To the extent that a reader has any questions regarding the applicability of any specific issue discussed above to his/her individual situation, he/she is encouraged to consult with the professional advisor of his/her choosing. Monument Wealth Management is neither a law firm nor a certified public accounting firm and no portion of the blog content should be construed as legal or accounting advice. A copy of Monument Wealth Management’s current written disclosure statement discussing our advisory services and fees is available for review upon request.

David B. Armstrong, CFA
President & Co-Founder
Dave got into the industry when he discovered his passion for finance in his mid-20’s. He’s a combat veteran and served as an officer in the United States Marines Corps on both active duty and in the reserves, retiring at the rank of Lieutenant Colonel. While serving on active duty, Dave was unable to spend money on deployments, so he became a self-taught investor. Along with a few bucks cash as a bouncer, his investing performance grew to be good....
IMPORTANT DISCLOSURE INFORMATION
Please remember that past performance is no guarantee of future results. Different types of investments involve varying degrees of risk, and there can be no assurance that the future performance of any specific investment, investment strategy, or product (including the investments and/or investment strategies recommended or undertaken by Monument Capital Management, LLC [“Monument”]), or any non-investment related content, made reference to directly or indirectly in this blog will be profitable, equal any corresponding indicated historical performance level(s), be suitable for your portfolio or individual situation, or prove successful. Due to various factors, including changing market conditions and/or applicable laws, the content may no longer be reflective of current opinions or positions. Moreover, you should not assume that any discussion or information contained in this blog serves as the receipt of, or as a substitute for, personalized investment advice from Monument. To the extent that a reader has any questions regarding the applicability of any specific issue discussed above to his/her individual situation, he/she is encouraged to consult with the professional advisor of his/her choosing. No amount of prior experience or success should be construed that a certain level of results or satisfaction will be achieved if Monument is engaged, or continues to be engaged, to provide investment advisory services. Monument is neither a law firm nor a certified public accounting firm and no portion of the blog content should be construed as legal or accounting advice.
A copy of the Monument’s current written disclosure Brochure discussing our advisory services and fees is available for review upon request or at www.monumentwealthmanagement.com/disclosures. Please Note: Monument does not make any representations or warranties as to the accuracy, timeliness, suitability, completeness, or relevance of any information prepared by any unaffiliated third party, whether linked to Monument’s website or blog or incorporated herein, and takes no responsibility for any such content. All such information is provided solely for convenience purposes only and all users thereof should be guided accordingly.
Historical performance results for investment indices, benchmarks, and/or categories have been provided for general informational/comparison purposes only, and generally do not reflect the deduction of transaction and/or custodial charges, the deduction of an investment management fee, nor the impact of taxes, the incurrence of which would have the effect of decreasing historical performance results. It should not be assumed that your Monument account holdings correspond directly to any comparative indices or categories. Please Also Note: (1) performance results do not reflect the impact of taxes; (2) comparative benchmarks/indices may be more or less volatile than your Monument accounts; and, (3) a description of each comparative benchmark/index is available upon request.
Please Remember: If you are a Monument client, please contact Monument, in writing, if there are any changes in your personal/financial situation or investment objectives for the purpose of reviewing/evaluating/revising our previous recommendations and/or services, or if you would like to impose, add, or to modify any reasonable restrictions to our investment advisory services. Unless, and until, you notify us, in writing, to the contrary, we shall continue to provide services as we do currently. Please Also Remember to advise us if you have not been receiving account statements (at least quarterly) from the account custodian.