Explore Our
“Off The Wall” Blog
Unique, straight-forward, unfiltered opinion on topics of concern for individuals with newfound wealth.
So Much for the Dog Days of August!

The news has been depressing lately. There’s renewed talk of recession, a stressed labor market, a restrained (spending) consumer and the ongoing euro-zone worries.
But you wouldn’t know it by looking at the major averages, which are all showing respectable gains for the year.
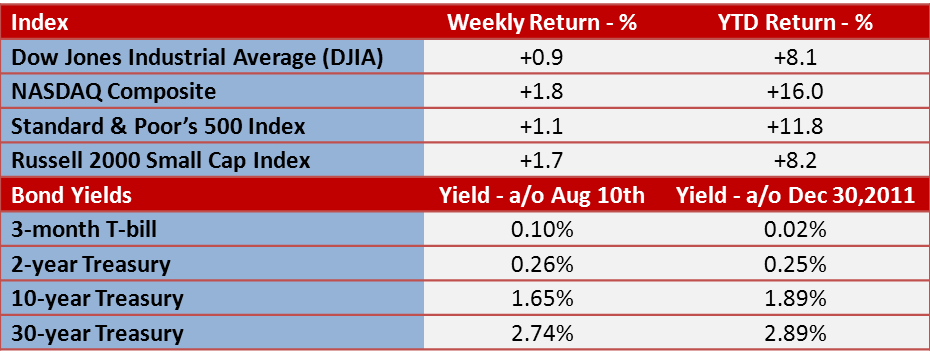
In fact – let’s take a look at a chart of the Standard & Poor’s 500 Index since the end of last September.

Now ask yourself how many times you heard that the sky was falling over that time. Yeah, sure there are plenty of scary sell-offs in there.
This rally has been dull. Additionally, the volume has been very light, especially last week. Pick up any weekly financial publication and you can’t miss the references to the light volume.
Volume? Seriously?
If you are an investor with a good plan and a good investment strategy going about your everyday life enjoying yourself and your summer, do you really care that we got within multiyear highs on light volume?
So how did we get here?
First, the Q2 earnings season. Top line revenue results were horrible with over half missing their forecasts – the worst since the 2008 crisis. Also, profits weren’t up much from one year ago, and will most likely come in at only 2.8% higher. BUT, profits did manage to beat the lowered expectations, and investors let out a collective sigh of relief.
Second, and more importantly, the expectation of central bank intervention is really helping.
Third, the housing sector is rocking and as long as it holds up, there is little chance of recession. Housing is important for employment, but more important are the prices of houses. If someone sells their home for a higher price, everyone in town feels good. They feel RICHER. And that helps confidence. The National Association of Realtors reported that prices are increasing in 75% of towns across the U.S.
Forth, there have been some positive economic reports out lately – July payroll data from two weeks ago was pretty good and there was another decline in weekly unemployment claims last week as well.
Finally, the deepening crisis in Europe may be forcing the tough-talking yet ever-reluctant and conservative European Central Bank (ECB) into action.
So even though we are experiencing a global growth slowdown, there are some pieces of good news that are contributing to a nice rally.
Upcoming Week
Looking to next week, the economic calendar includes the release of retail sales. After three consecutive monthly declines (April, May & June), better-than-expected same-store sales from the major retailers have analysts betting the losing streak will come to an end when the report comes out for July. It would be a welcome report to see July with a positive outcome.
Our Thoughts
Our position remains that the U.S will not see a double-dip recession so long as housing does not experience another downturn, and our domestic economy will continue to grow in the most modest of ways. 2012 will probably end up looking a lot like 2010 and 2011 where slightly weakening or sideways markets will give way to improvement over the fall. Given that a little weakening or sideways action would take place from a +11% YTD number on the Standard & Poor’s 500 (S&P 500) suggest to us that the overall YTD return should be much better than people may think.
Please call or email with questions.
IMPORTANT NOTE: Due to industry regulations, comments are not permitted on this blog. If you would like to contact the author, please email us at info@monumentwm.com.
Securities and Financial Planning offered through LPL Financial, a Registered Investment Advisor. Member FINRA/SIPC
The opinions voiced in this material are for general information only and are not intended to provide specific advice or recommendations for any individual. To determine which investment(s) may be appropriate for you, consult your financial advisor prior to investing. All performance referenced is historical and is no guarantee of future results. All indices are unmanaged and cannot be invested into directly. Stock investing involves risk including loss of principal. The Dow Jones Industrial Average is comprised of 30 stocks that are major factors in their industries, and widely held by individuals and institutional investors. The Standard & Poor’s 500 Stock Index (S&P 500) is an unmanaged capitalization weighted index of 500 stocks designed to measure performance of the broad domestic economy through changes in the aggregate market value of 500 stocks representing all major industries. The NASDAQ Composite Index measures all domestic and non-U.S. based common stocks listed on The NASDAQ Stock Market. The market value, the last sale price multiplied by total shares outstanding, is calculated throughout the trading day, and is related to the total value of the Index. The Russell 2000 Small Stock Index is an unmanaged index generally representative of the 2000 smallest companies in the Russell 3000 Index. The Russell 2000 is an unmanaged index generally comprised of companies with lower price-to-book ratios and lower forecasted growth values. The 2, 10 and 30 year Treasury is simply the yield at the close of the day.

David B. Armstrong, CFA
President & Co-Founder
Dave got into the industry when he discovered his passion for finance in his mid-20’s. He’s a combat veteran and served as an officer in the United States Marines Corps on both active duty and in the reserves, retiring at the rank of Lieutenant Colonel. While serving on active duty, Dave was unable to spend money on deployments, so he became a self-taught investor. Along with a few bucks cash as a bouncer, his investing performance grew to be good....
IMPORTANT DISCLOSURE INFORMATION
Please remember that past performance is no guarantee of future results. Different types of investments involve varying degrees of risk, and there can be no assurance that the future performance of any specific investment, investment strategy, or product (including the investments and/or investment strategies recommended or undertaken by Monument Capital Management, LLC [“Monument”]), or any non-investment related content, made reference to directly or indirectly in this blog will be profitable, equal any corresponding indicated historical performance level(s), be suitable for your portfolio or individual situation, or prove successful. Due to various factors, including changing market conditions and/or applicable laws, the content may no longer be reflective of current opinions or positions. Moreover, you should not assume that any discussion or information contained in this blog serves as the receipt of, or as a substitute for, personalized investment advice from Monument. To the extent that a reader has any questions regarding the applicability of any specific issue discussed above to his/her individual situation, he/she is encouraged to consult with the professional advisor of his/her choosing. No amount of prior experience or success should be construed that a certain level of results or satisfaction will be achieved if Monument is engaged, or continues to be engaged, to provide investment advisory services. Monument is neither a law firm nor a certified public accounting firm and no portion of the blog content should be construed as legal or accounting advice.
A copy of the Monument’s current written disclosure Brochure discussing our advisory services and fees is available for review upon request or at www.monumentwealthmanagement.com/disclosures. Please Note: Monument does not make any representations or warranties as to the accuracy, timeliness, suitability, completeness, or relevance of any information prepared by any unaffiliated third party, whether linked to Monument’s website or blog or incorporated herein, and takes no responsibility for any such content. All such information is provided solely for convenience purposes only and all users thereof should be guided accordingly.
Historical performance results for investment indices, benchmarks, and/or categories have been provided for general informational/comparison purposes only, and generally do not reflect the deduction of transaction and/or custodial charges, the deduction of an investment management fee, nor the impact of taxes, the incurrence of which would have the effect of decreasing historical performance results. It should not be assumed that your Monument account holdings correspond directly to any comparative indices or categories. Please Also Note: (1) performance results do not reflect the impact of taxes; (2) comparative benchmarks/indices may be more or less volatile than your Monument accounts; and, (3) a description of each comparative benchmark/index is available upon request.
Please Remember: If you are a Monument client, please contact Monument, in writing, if there are any changes in your personal/financial situation or investment objectives for the purpose of reviewing/evaluating/revising our previous recommendations and/or services, or if you would like to impose, add, or to modify any reasonable restrictions to our investment advisory services. Unless, and until, you notify us, in writing, to the contrary, we shall continue to provide services as we do currently. Please Also Remember to advise us if you have not been receiving account statements (at least quarterly) from the account custodian.