Explore Our
“Off The Wall” Blog
Unique, straight-forward, unfiltered opinion on topics of concern for individuals with newfound wealth.
Stocks Are On A Roll – What Now?

Last week was a busy one for me. I had a dinner meeting every evening and there was a resounding theme, both implicit and explicit, in almost every conversation we had – “Is now a good time to add money to portfolios or start taking chips off the table?”
Answer: I don’t know. How could I? But that still does not absolve me from needing to look at things and form some sort of opinion. I thought I’d take a few paragraphs to explain one of the things that has shaped our opinion-making process.
I believe in gathering evidence from an assortment of sources.
I’m not just talking about a bunch of different research sources, I’m also talking about combining several different disciplines and ways of thinking. I believe that different disciplines and sources get combined with experiences to assist in shaping the way the world of investing should be seen.
Psychology, math, history, physics, philosophy, probabilities, statistics, fundamental analysis, economics, technical analysis – each one its own discipline. Taken individually, they are not very useful in forming an opinion (Unless you are an expert or teaching in that particular discipline). But when taken together and combined with experiences, patterns can be identified, and those can be useful.
With that said, I want to look at a few charts. Admittedly, charts and technical analysis taken in a vacuum are not the tell-all secret to to anything market-related. However, they do show some combined forces at work at the same time.
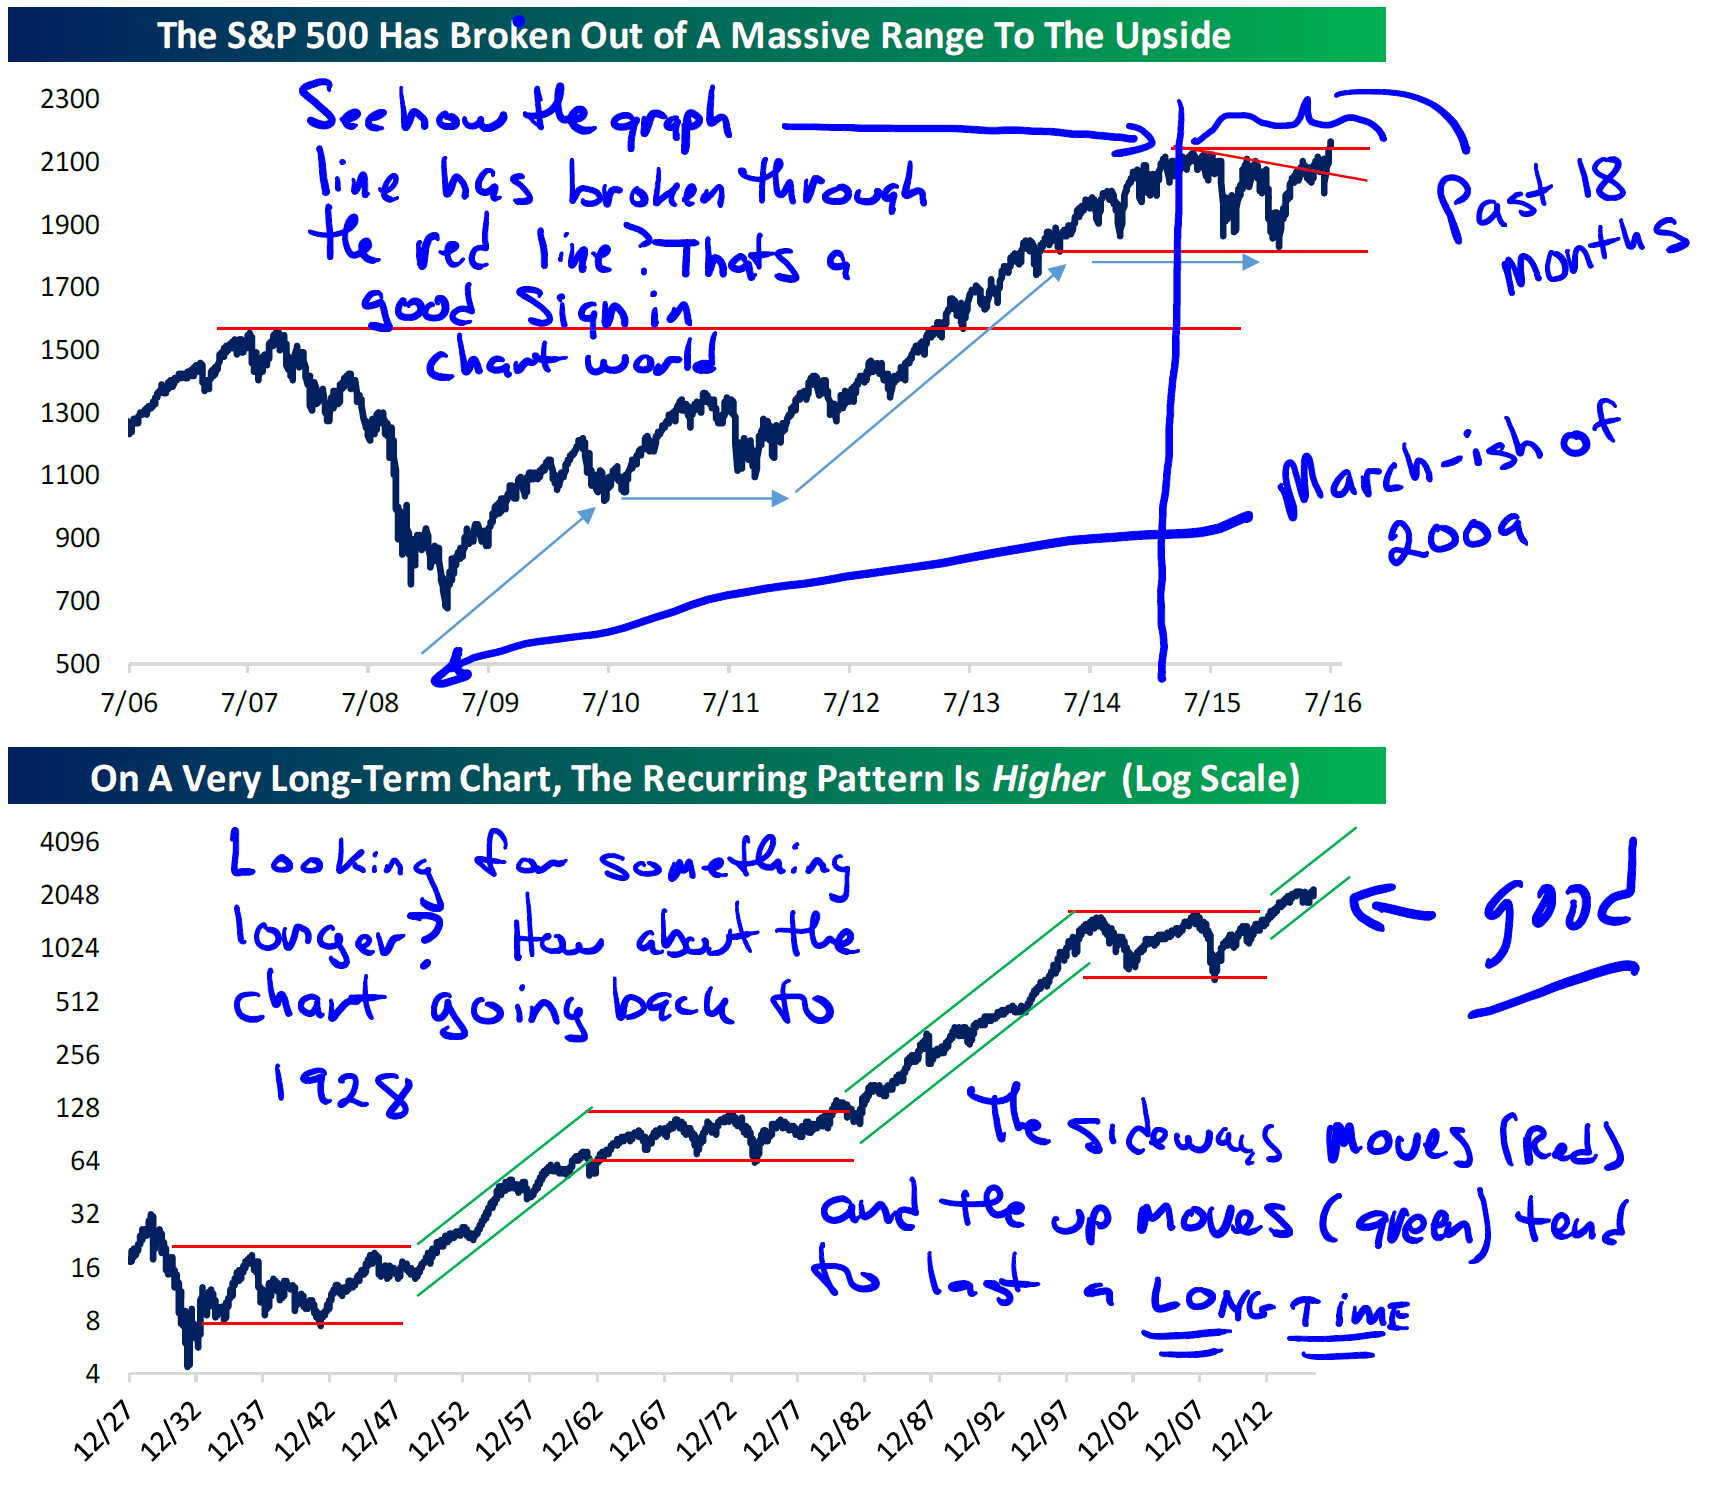
If you look at these two charts from the latest Bespoke research report, you can see that the S&P 500 has really broken out to the upside.
The first chart suggests there is further upside for stocks. The second is a much longer term chart that goes back to 1928. See those three sidways channels that are highlighted in red? Those are referred to as “consolidations”. There are only three going all the way back to 1928 and we just slogged through one of them. They last a long time. I’m not suggesting that history is required to repeat itself, but it certainly looks positive for the market coming off a consolidation that lasted for a decade…and a half. The good news from my perspective is that we are seeing this uptrend on the heels of some stronger economic data from the past few weeks.
This bull market (as defined by a 20% upward move off the previous low) started on March 9th, 2009 and is now the second longest since 1928. According to Bespoke Research, the S&P 500 has increased 220% from March 9th, 2009. That makes it the fourth ranking bull market in terms of return since 1928. That’s 1,852 trading days.
What is the number one bull market in terms of rank? The December, 1987 to March, 2000 bull run. (Trivia: I started out in my post-MBA training program at the old Donaldson Lufkin and Jenrette in August of 1999 and started “live” in January of 2000… perfect timing, right?) That bull market had a 582% return off the bottom. Number three was the bull market from August of 1982 through August of 1987. That return was 228%.
MY POINT: If you were an investor in August of 1982 and you did nothing in the very short (time-wise) market downturn between August of 1987 and December of 1987, you would have been a participant in the first and third ranking bull market runs in history.
Please do me a favor and try to identify the bear market decline that took place between August of 1987 and December of 1987 in the second chart. You can see it, but doesn’t it look like NOISE in the grand scheme of things?
This is why you identify the liquidity you need well in advance of needing it, so you stay invested for the long term and not panic during the downturns.
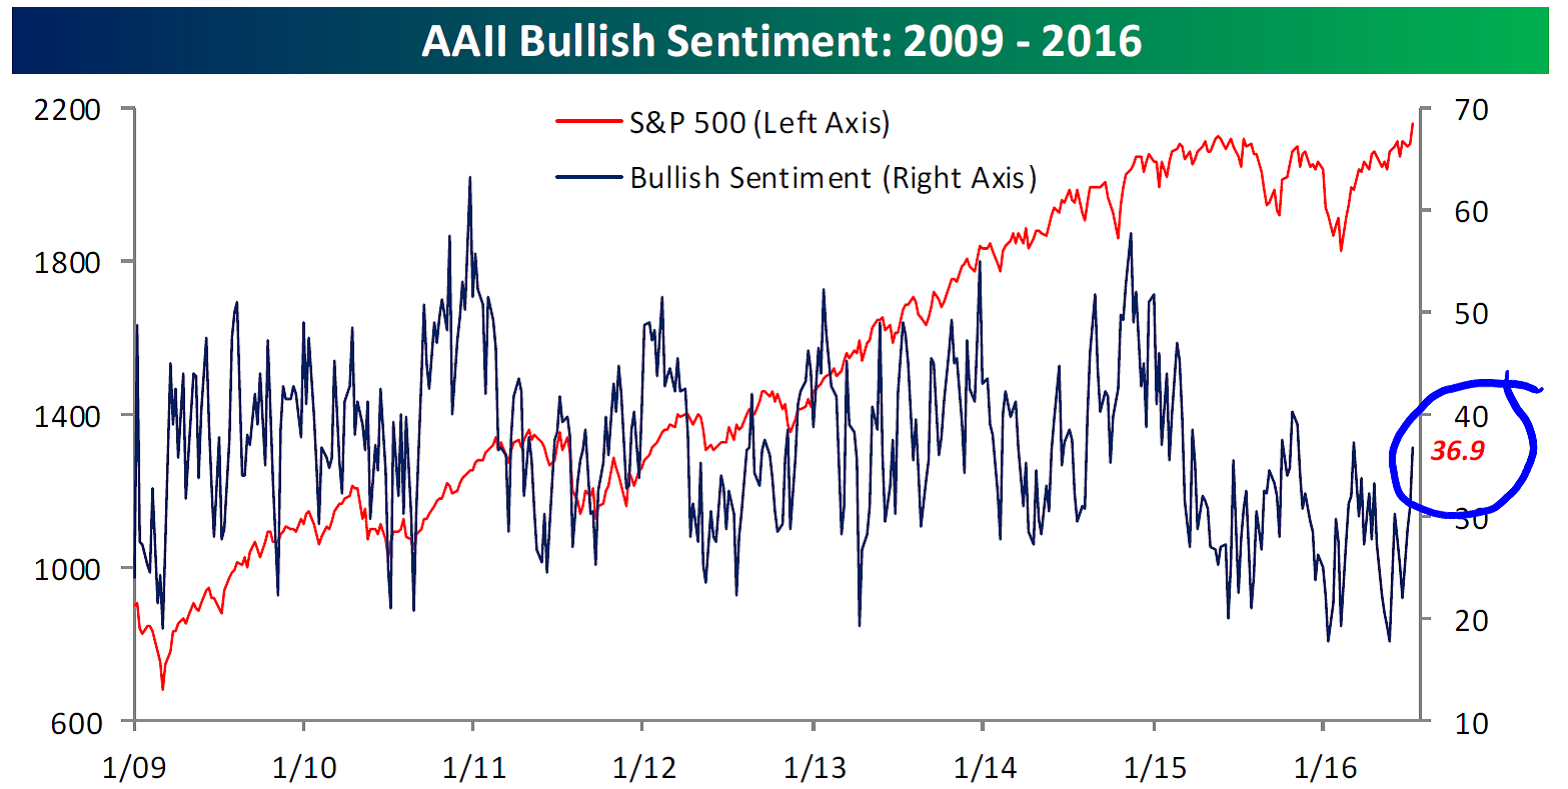
I also don’t think that the individual investor had gotten ahead of themselves too much. Here’s a chart that shows the sentiment survey reading from the American Association of Individual Investors (AAII). When you see the chart, you’ll see a bug move up. In fact, there has been a 19 percentage point move up in this survey since May. HOWEVER, the current reading of 36.9 is still below the bull market average reading of 39.95% and we have not seen this survey report a number above 40 in 37 straight weeks. (Chart from Bespoke)
Here are a few reasons that I see for the market being up:
- Mayhem following Brexit is evaporating.
- Earnings season is getting underway and so far, the reports have been decent.
- As previously mentioned, economic reports over the past few weeks have surpassed expectations.
- Fed hikes seem off the table and even if they materialize, they are likely to come at a gradual pace.
- Finally, S&P 500 companies are pouring cash into stock buybacks.
Valuations
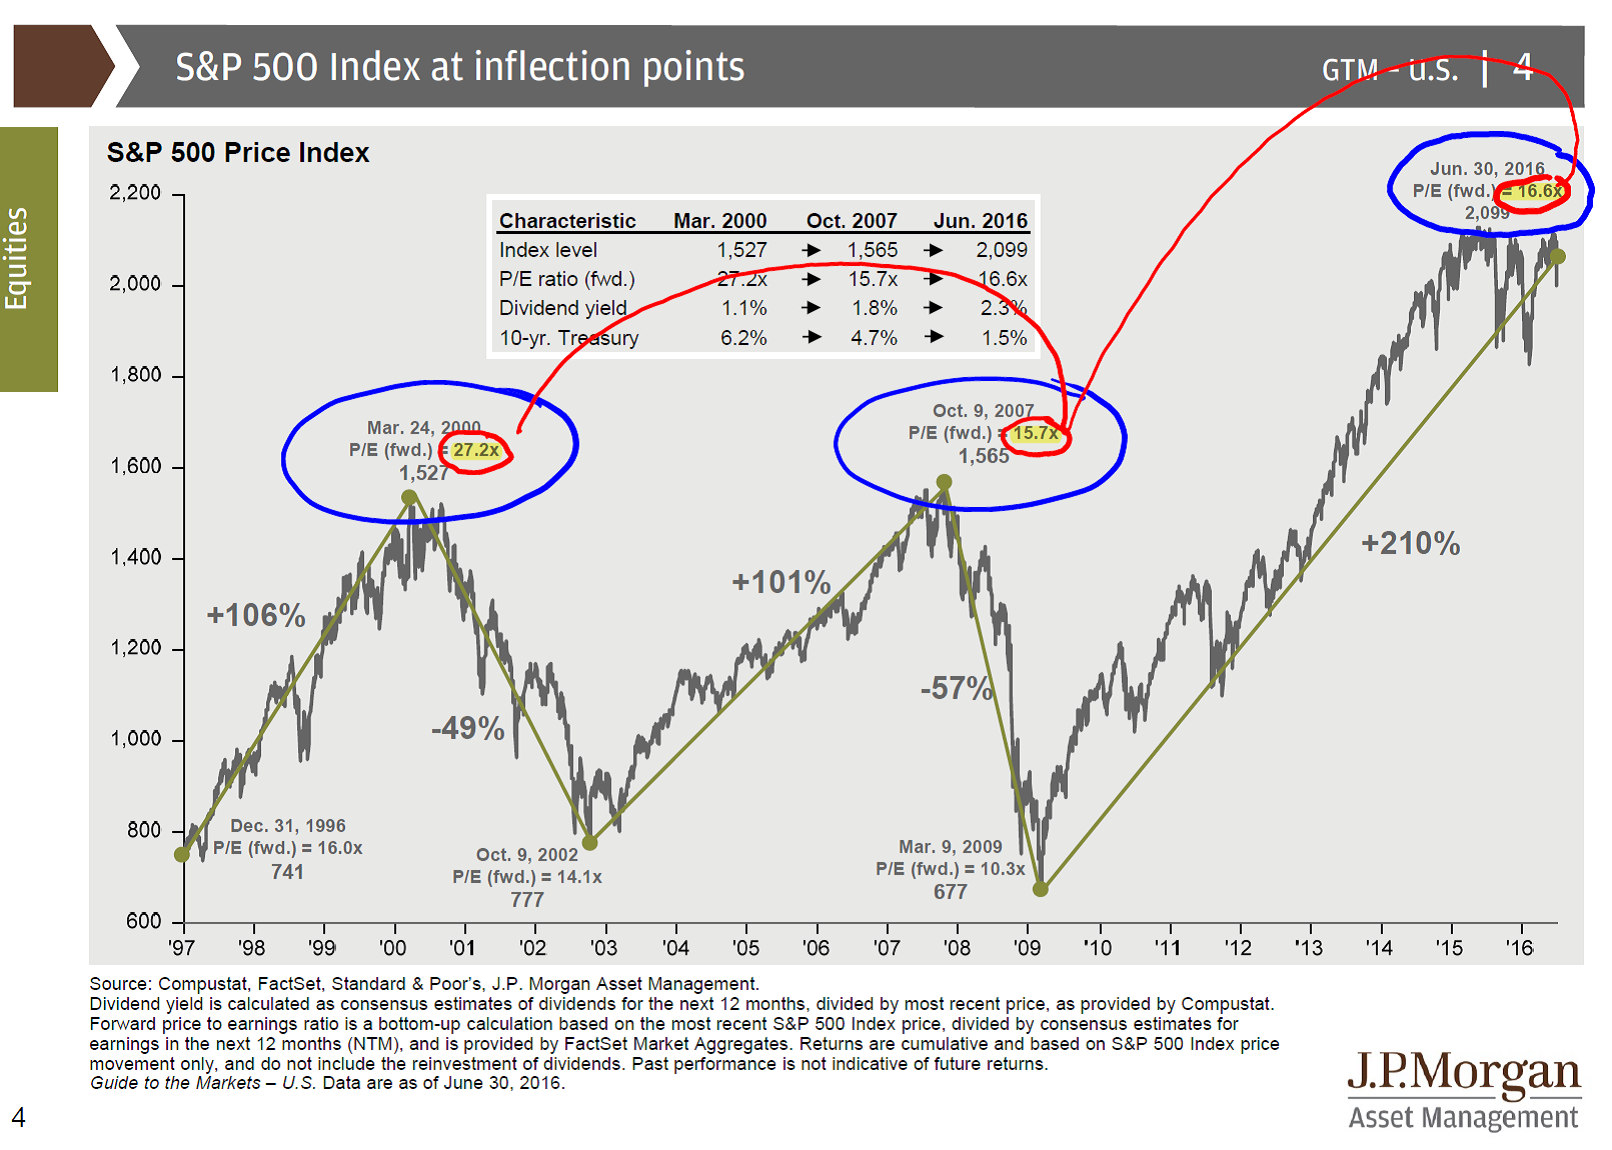
Let’s see how earnings season holds up, but I’m not of the opinion that the market has gotten super expensive. To be fair, it has certainly gotten more expensive and short-term overbought, but the charts below from JP Morgan show that the current Forward P/E Ratios on the S&P 500 are not nuts. In March of 2000, we saw a Forward P/E of 27.2. October of 2007 was 15.7 and now we are at 16.6. If earnings are good, we will see that P/E come down.
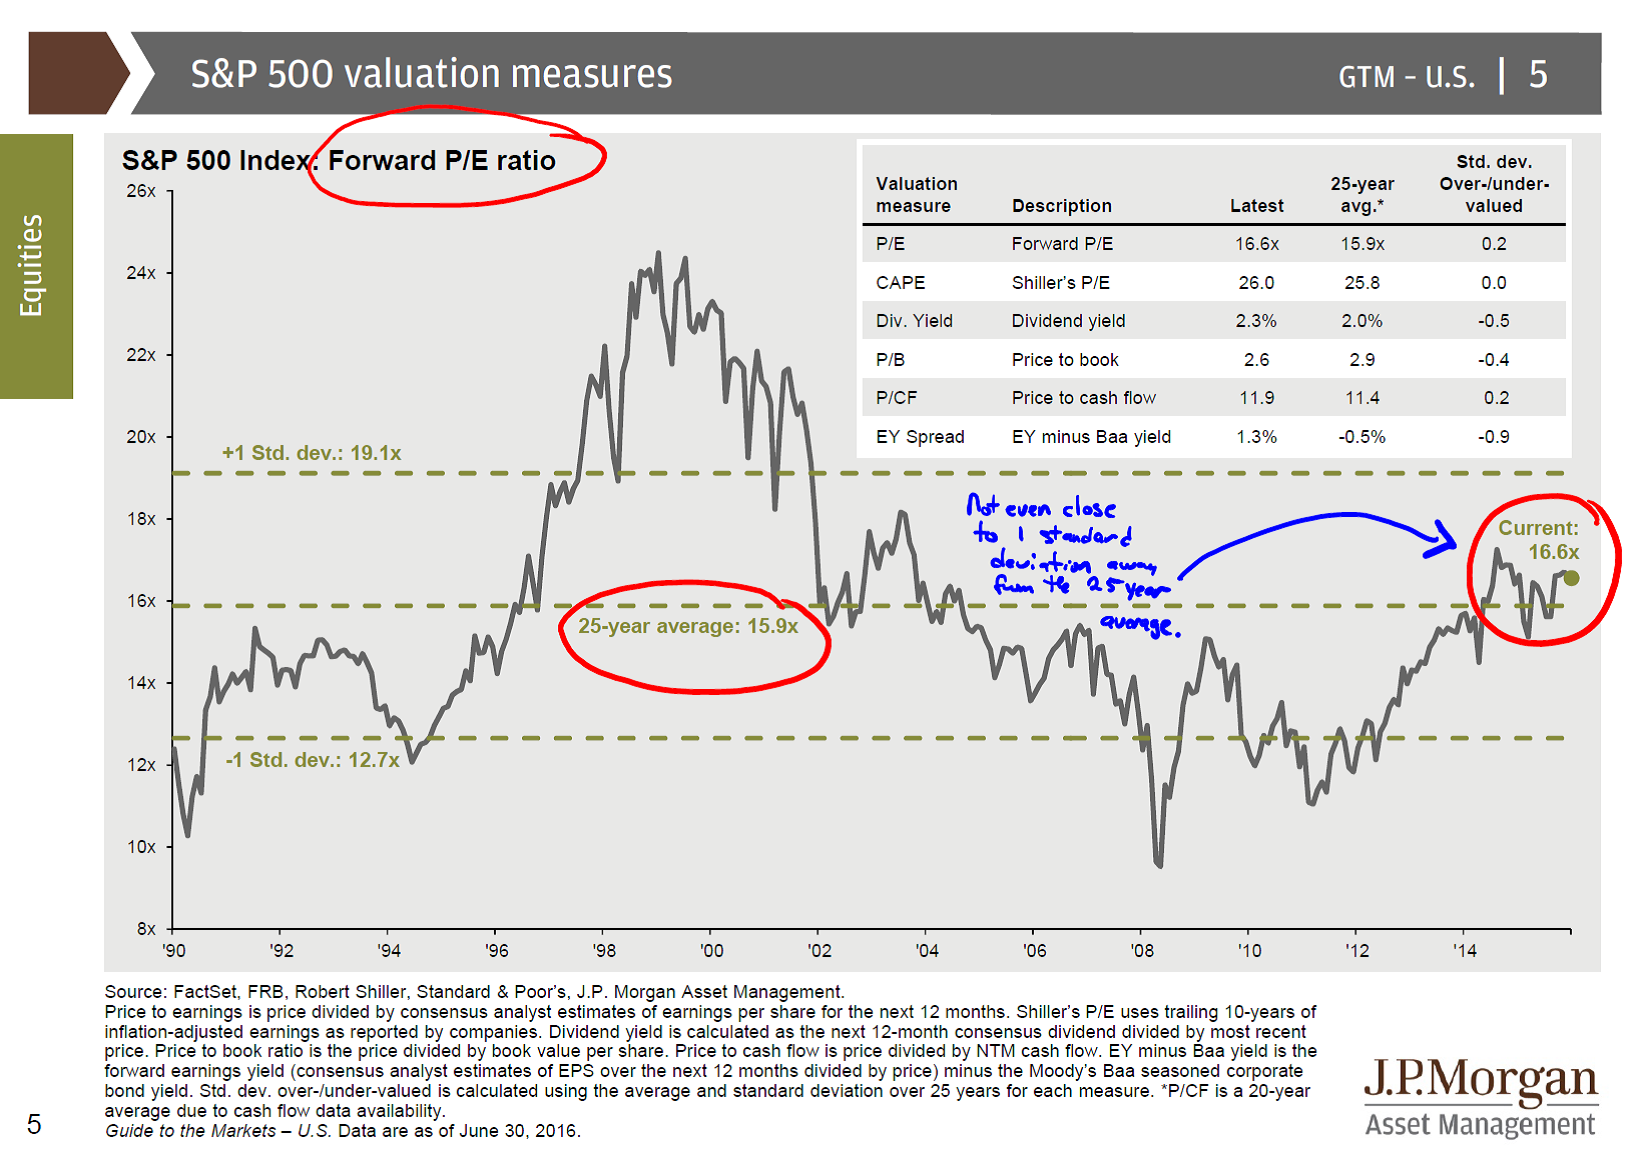
 Also, let’s keep the 25-year average in mind. Below, you can see that the current P/E of 16.6 is nowhere close to being one standard deviation away from the 25-year norm.
For those of you that point to the fact that the Forward P/E from back in the Tech Bubble was, well, during the Tech Bubble, I will counter with the opinion that I simply do not see any sort of mania developing in the market. Unless you classify Pokémon Go as a mania. For that, you are on your own…I’m not into it. Probably because I have a lot of shit to do…and I’m not 12.
Please call or email with questions.
 Important Disclosure Information for “Stocks Are On A Roll – What Now?”
Please remember that past performance may not be indicative of future results. Different types of investments involve varying degrees of risk, and there can be no assurance that the future performance of any specific investment, investment strategy, or product (including the investments and/or investment strategies recommended or undertaken by Monument Wealth Management), or any non-investment related content, made reference to directly or indirectly in this blog will be profitable, equal any corresponding indicated historical performance level(s), be suitable for your portfolio or individual situation, or prove successful. All indexes referenced are unmanaged and cannot be invested into directly. The economic forecasts set forth may not develop as predicted. Due to various factors, including changing market conditions and/or applicable laws, the content may no longer be reflective of current opinions or positions. Moreover, you should not assume that any discussion or information contained in this blog serves as the receipt of, or as a substitute for, personalized investment advice from Monument Wealth Management. To the extent that a reader has any questions regarding the applicability of any specific issue discussed above to his/her individual situation, he/she is encouraged to consult with the professional advisor of his/her choosing. Monument Wealth Management is neither a law firm nor a certified public accounting firm and no portion of the blog content should be construed as legal or accounting advice. A copy of Monument Wealth Management’s current written disclosure statement discussing our advisory services and fees is available for review upon request.

David B. Armstrong, CFA
President & Co-Founder
Dave got into the industry when he discovered his passion for finance in his mid-20’s. He’s a combat veteran and served as an officer in the United States Marines Corps on both active duty and in the reserves, retiring at the rank of Lieutenant Colonel. While serving on active duty, Dave was unable to spend money on deployments, so he became a self-taught investor. Along with a few bucks cash as a bouncer, his investing performance grew to be good....
IMPORTANT DISCLOSURE INFORMATION
Please remember that past performance is no guarantee of future results. Different types of investments involve varying degrees of risk, and there can be no assurance that the future performance of any specific investment, investment strategy, or product (including the investments and/or investment strategies recommended or undertaken by Monument Capital Management, LLC [“Monument”]), or any non-investment related content, made reference to directly or indirectly in this blog will be profitable, equal any corresponding indicated historical performance level(s), be suitable for your portfolio or individual situation, or prove successful. Due to various factors, including changing market conditions and/or applicable laws, the content may no longer be reflective of current opinions or positions. Moreover, you should not assume that any discussion or information contained in this blog serves as the receipt of, or as a substitute for, personalized investment advice from Monument. To the extent that a reader has any questions regarding the applicability of any specific issue discussed above to his/her individual situation, he/she is encouraged to consult with the professional advisor of his/her choosing. No amount of prior experience or success should be construed that a certain level of results or satisfaction will be achieved if Monument is engaged, or continues to be engaged, to provide investment advisory services. Monument is neither a law firm nor a certified public accounting firm and no portion of the blog content should be construed as legal or accounting advice.
A copy of the Monument’s current written disclosure Brochure discussing our advisory services and fees is available for review upon request or at www.monumentwealthmanagement.com/disclosures. Please Note: Monument does not make any representations or warranties as to the accuracy, timeliness, suitability, completeness, or relevance of any information prepared by any unaffiliated third party, whether linked to Monument’s website or blog or incorporated herein, and takes no responsibility for any such content. All such information is provided solely for convenience purposes only and all users thereof should be guided accordingly.
Historical performance results for investment indices, benchmarks, and/or categories have been provided for general informational/comparison purposes only, and generally do not reflect the deduction of transaction and/or custodial charges, the deduction of an investment management fee, nor the impact of taxes, the incurrence of which would have the effect of decreasing historical performance results. It should not be assumed that your Monument account holdings correspond directly to any comparative indices or categories. Please Also Note: (1) performance results do not reflect the impact of taxes; (2) comparative benchmarks/indices may be more or less volatile than your Monument accounts; and, (3) a description of each comparative benchmark/index is available upon request.
Please Remember: If you are a Monument client, please contact Monument, in writing, if there are any changes in your personal/financial situation or investment objectives for the purpose of reviewing/evaluating/revising our previous recommendations and/or services, or if you would like to impose, add, or to modify any reasonable restrictions to our investment advisory services. Unless, and until, you notify us, in writing, to the contrary, we shall continue to provide services as we do currently. Please Also Remember to advise us if you have not been receiving account statements (at least quarterly) from the account custodian.