Explore Our
“Off The Wall” Blog
Unique, straight-forward, unfiltered opinion on topics of concern for individuals with newfound wealth.
Sanity in a Flat Market

Major equity markets in the US fell this week, with the S&P 500 (SPY) down around -0.9% and the Nasdaq 100 down 1.12%. Small-caps were down even more with the Russell 2000 dropping -1.95%. Take a look at the Bespoke chart below, see that line? It’s the line of pain investors have been feeling for 2 years now.
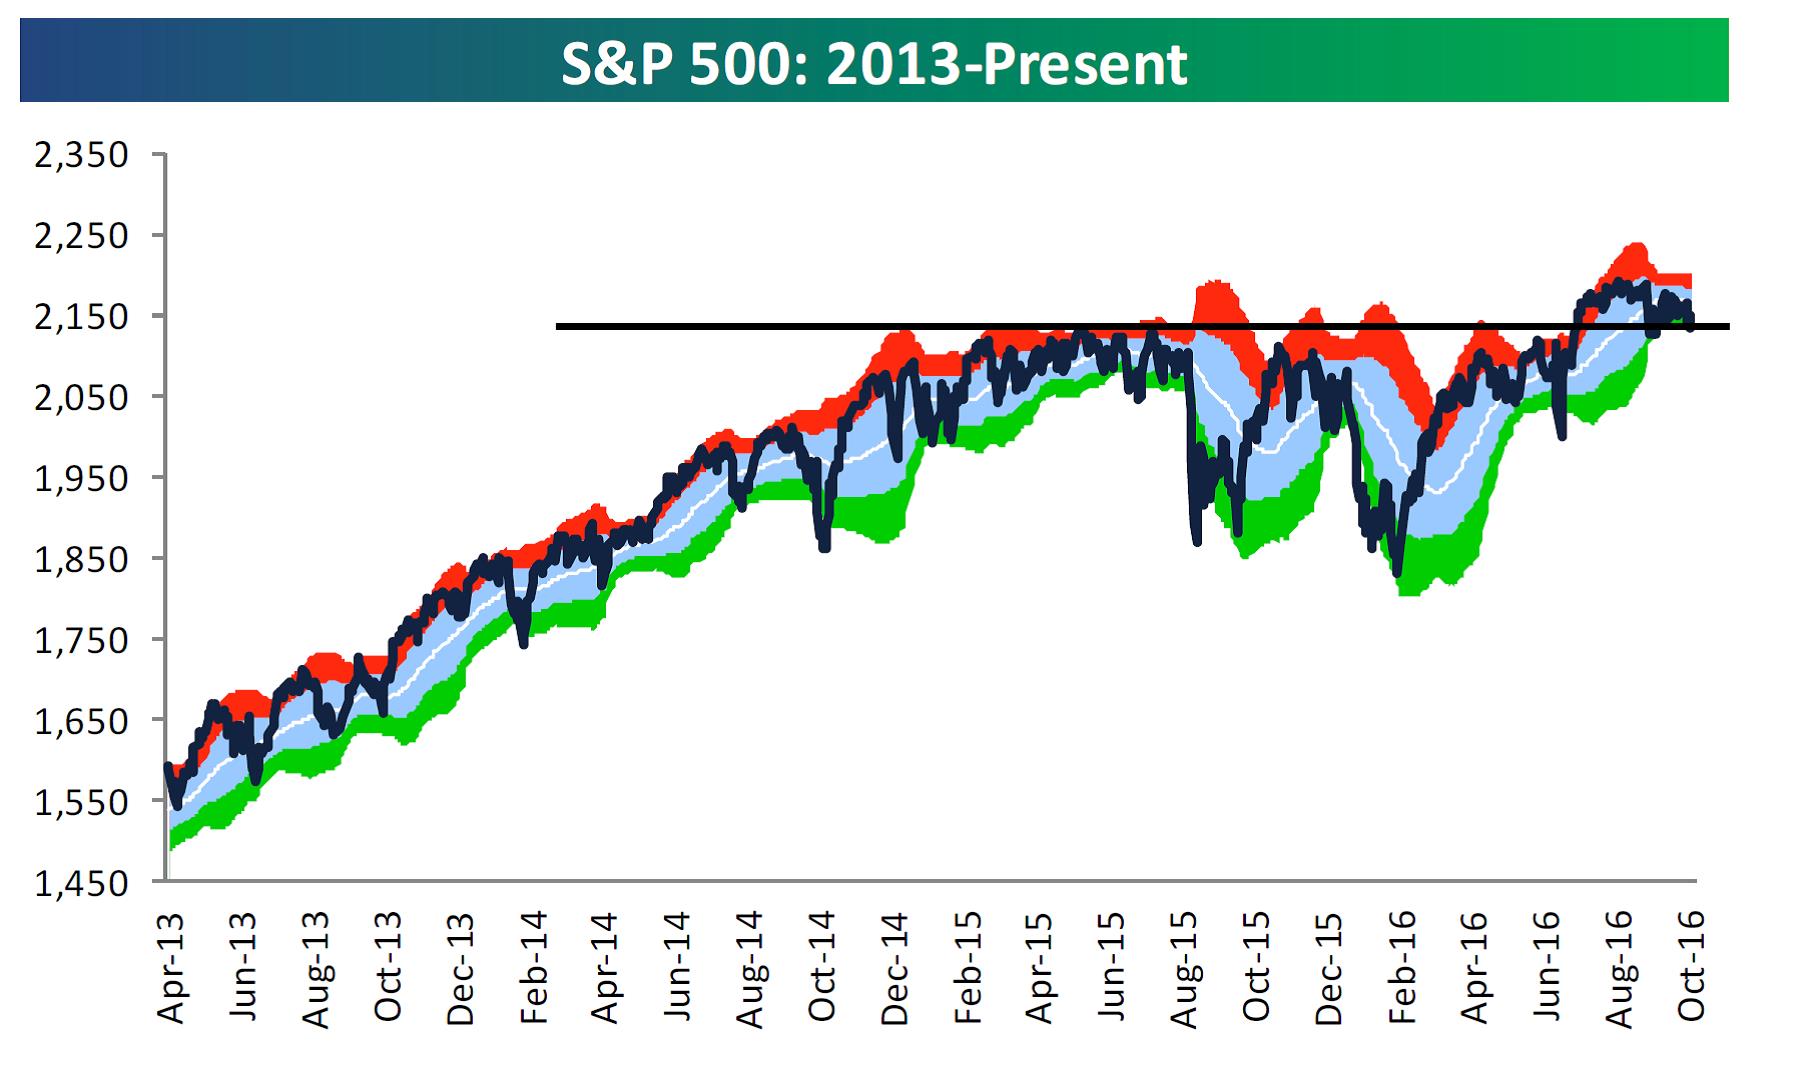
Investors are NOT EXCITED yet the stock market is not far off all-time highs. Keep in mind that jobless claims are at record lows (more on that below) and sentiment towards the market remains really depressed.
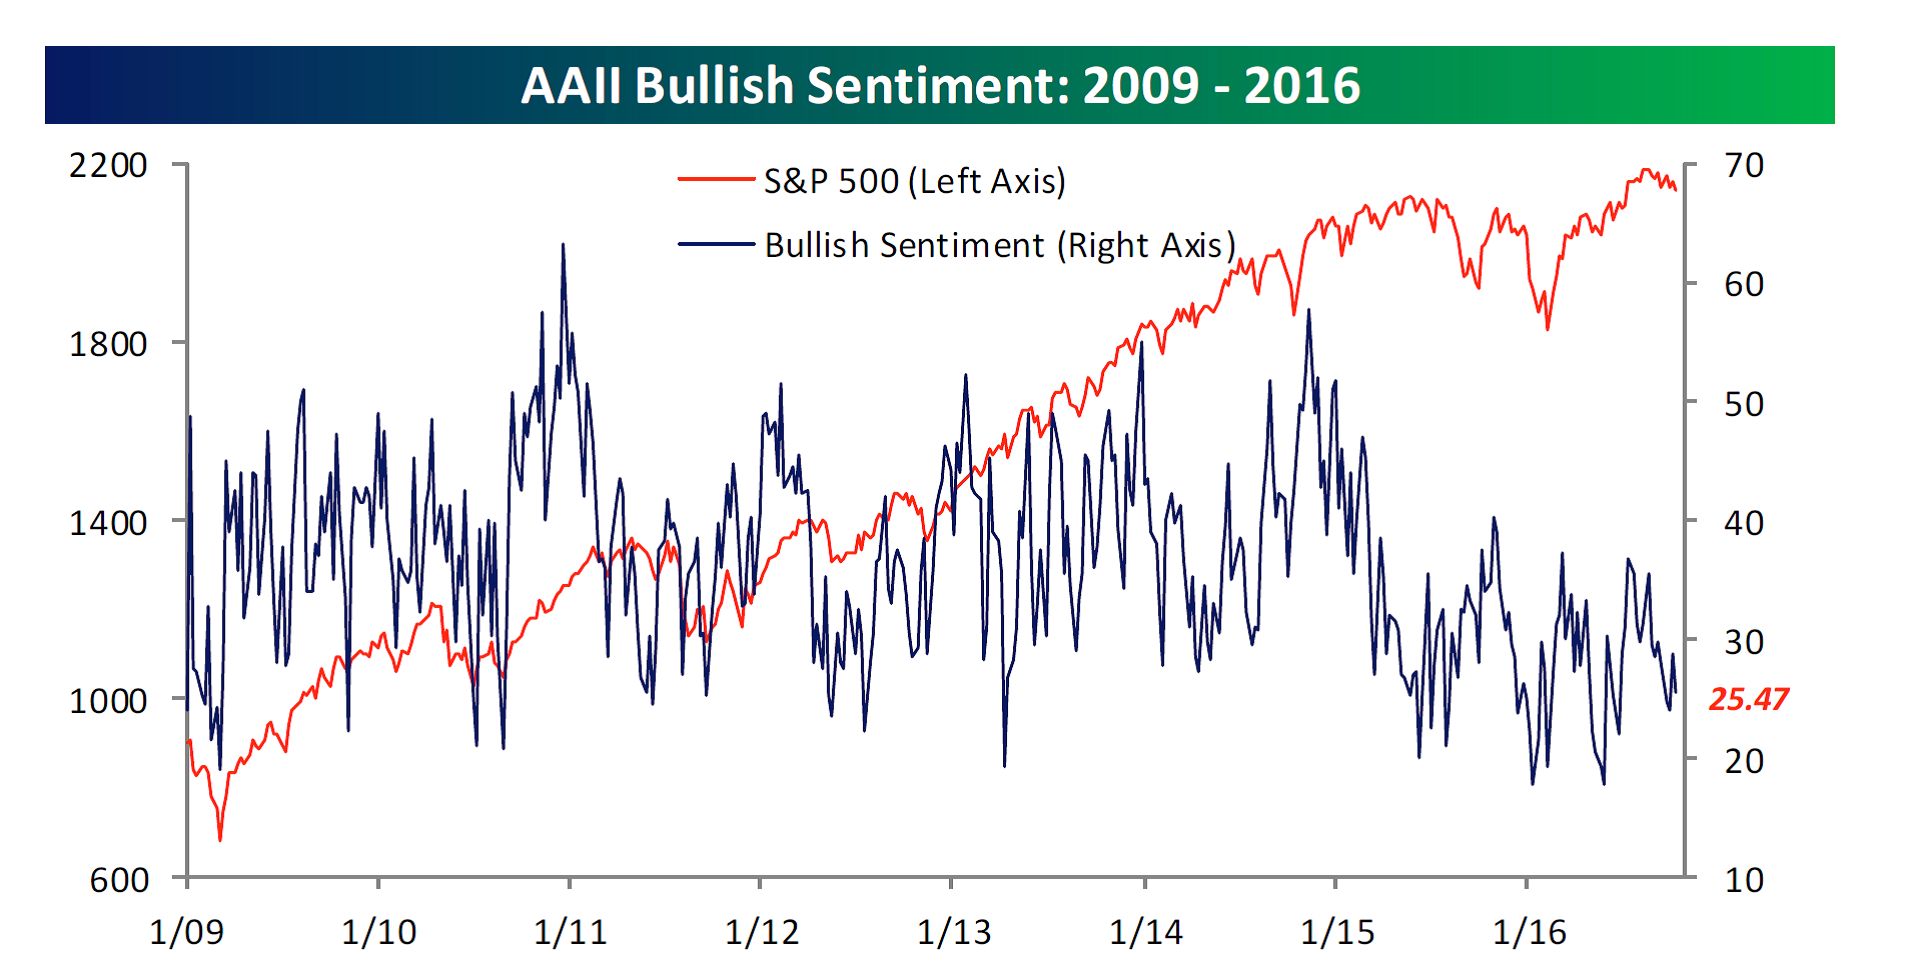
High bullish readings are generally pretty bad for stocks but as you can see below, bullish readings are currently depressed. If this AAII Bullish Sentiment Survey stays below 40% for the rest of the year (it’s the blue line and the current reading is 25.47), it will be the first year since survey began in 1987 that it didn’t go above 40% for entire year.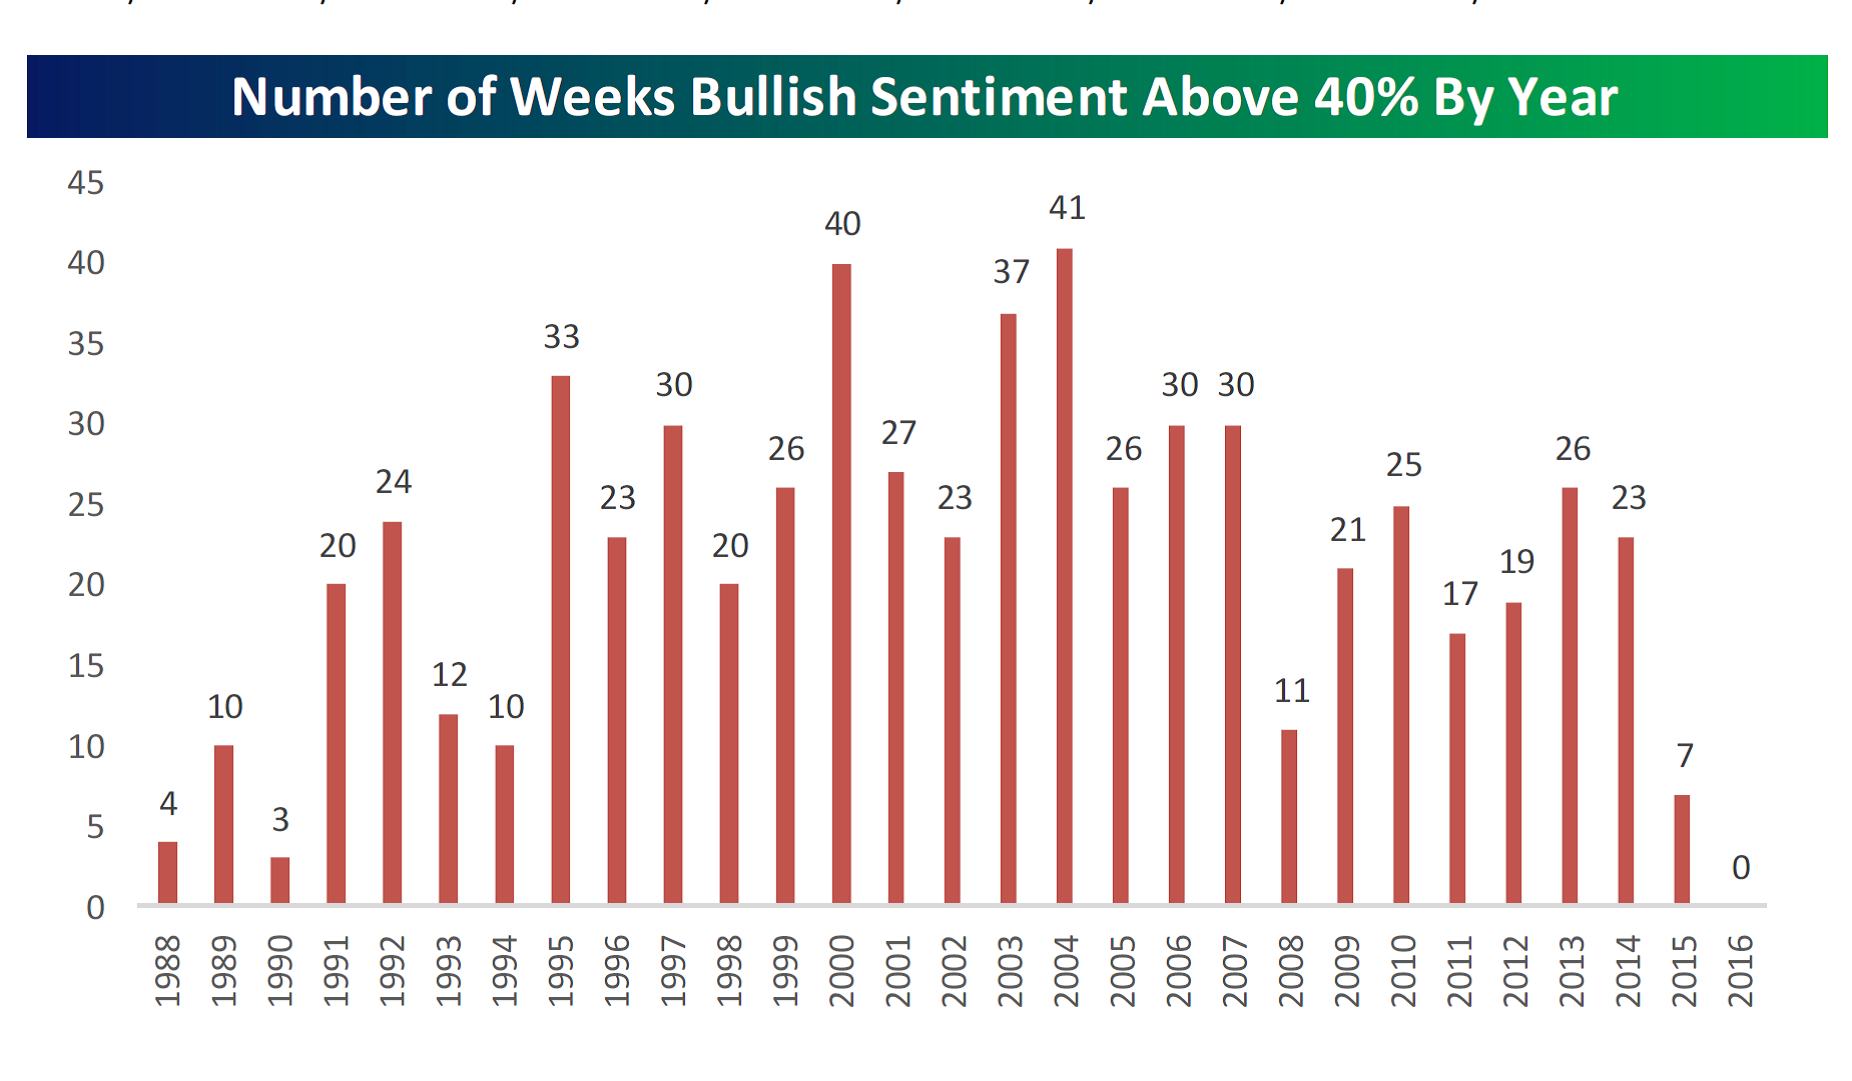
Earnings Season Begins
Earnings season got going this last week with Alcoa’s report on Tuesday morning – which was a poor report. No one likes to see earnings season open with a poor report but it’s not something to read into either. It’s just an emotional thing.
It’s obviously VERY early in the season but this week we saw 63% of the companies that reported beat consensus analyst earnings per share estimates. While it’s true it’s easy to clear a bar that lying on the floor (meaning no one has high expectations for earnings this quarter) this is still an early encouraging sign. As for revenue, just half of companies that reported beat their top-line revenue estimates. We have our eye on revenue – we’d like to see it stronger. Charts below from Bespoke show Earnings on the top chart and revenue on the lower chart.
This week has a lot of big companies reporting so it will be interesting to see how things look next Monday. But for now, here’s what we’ve got.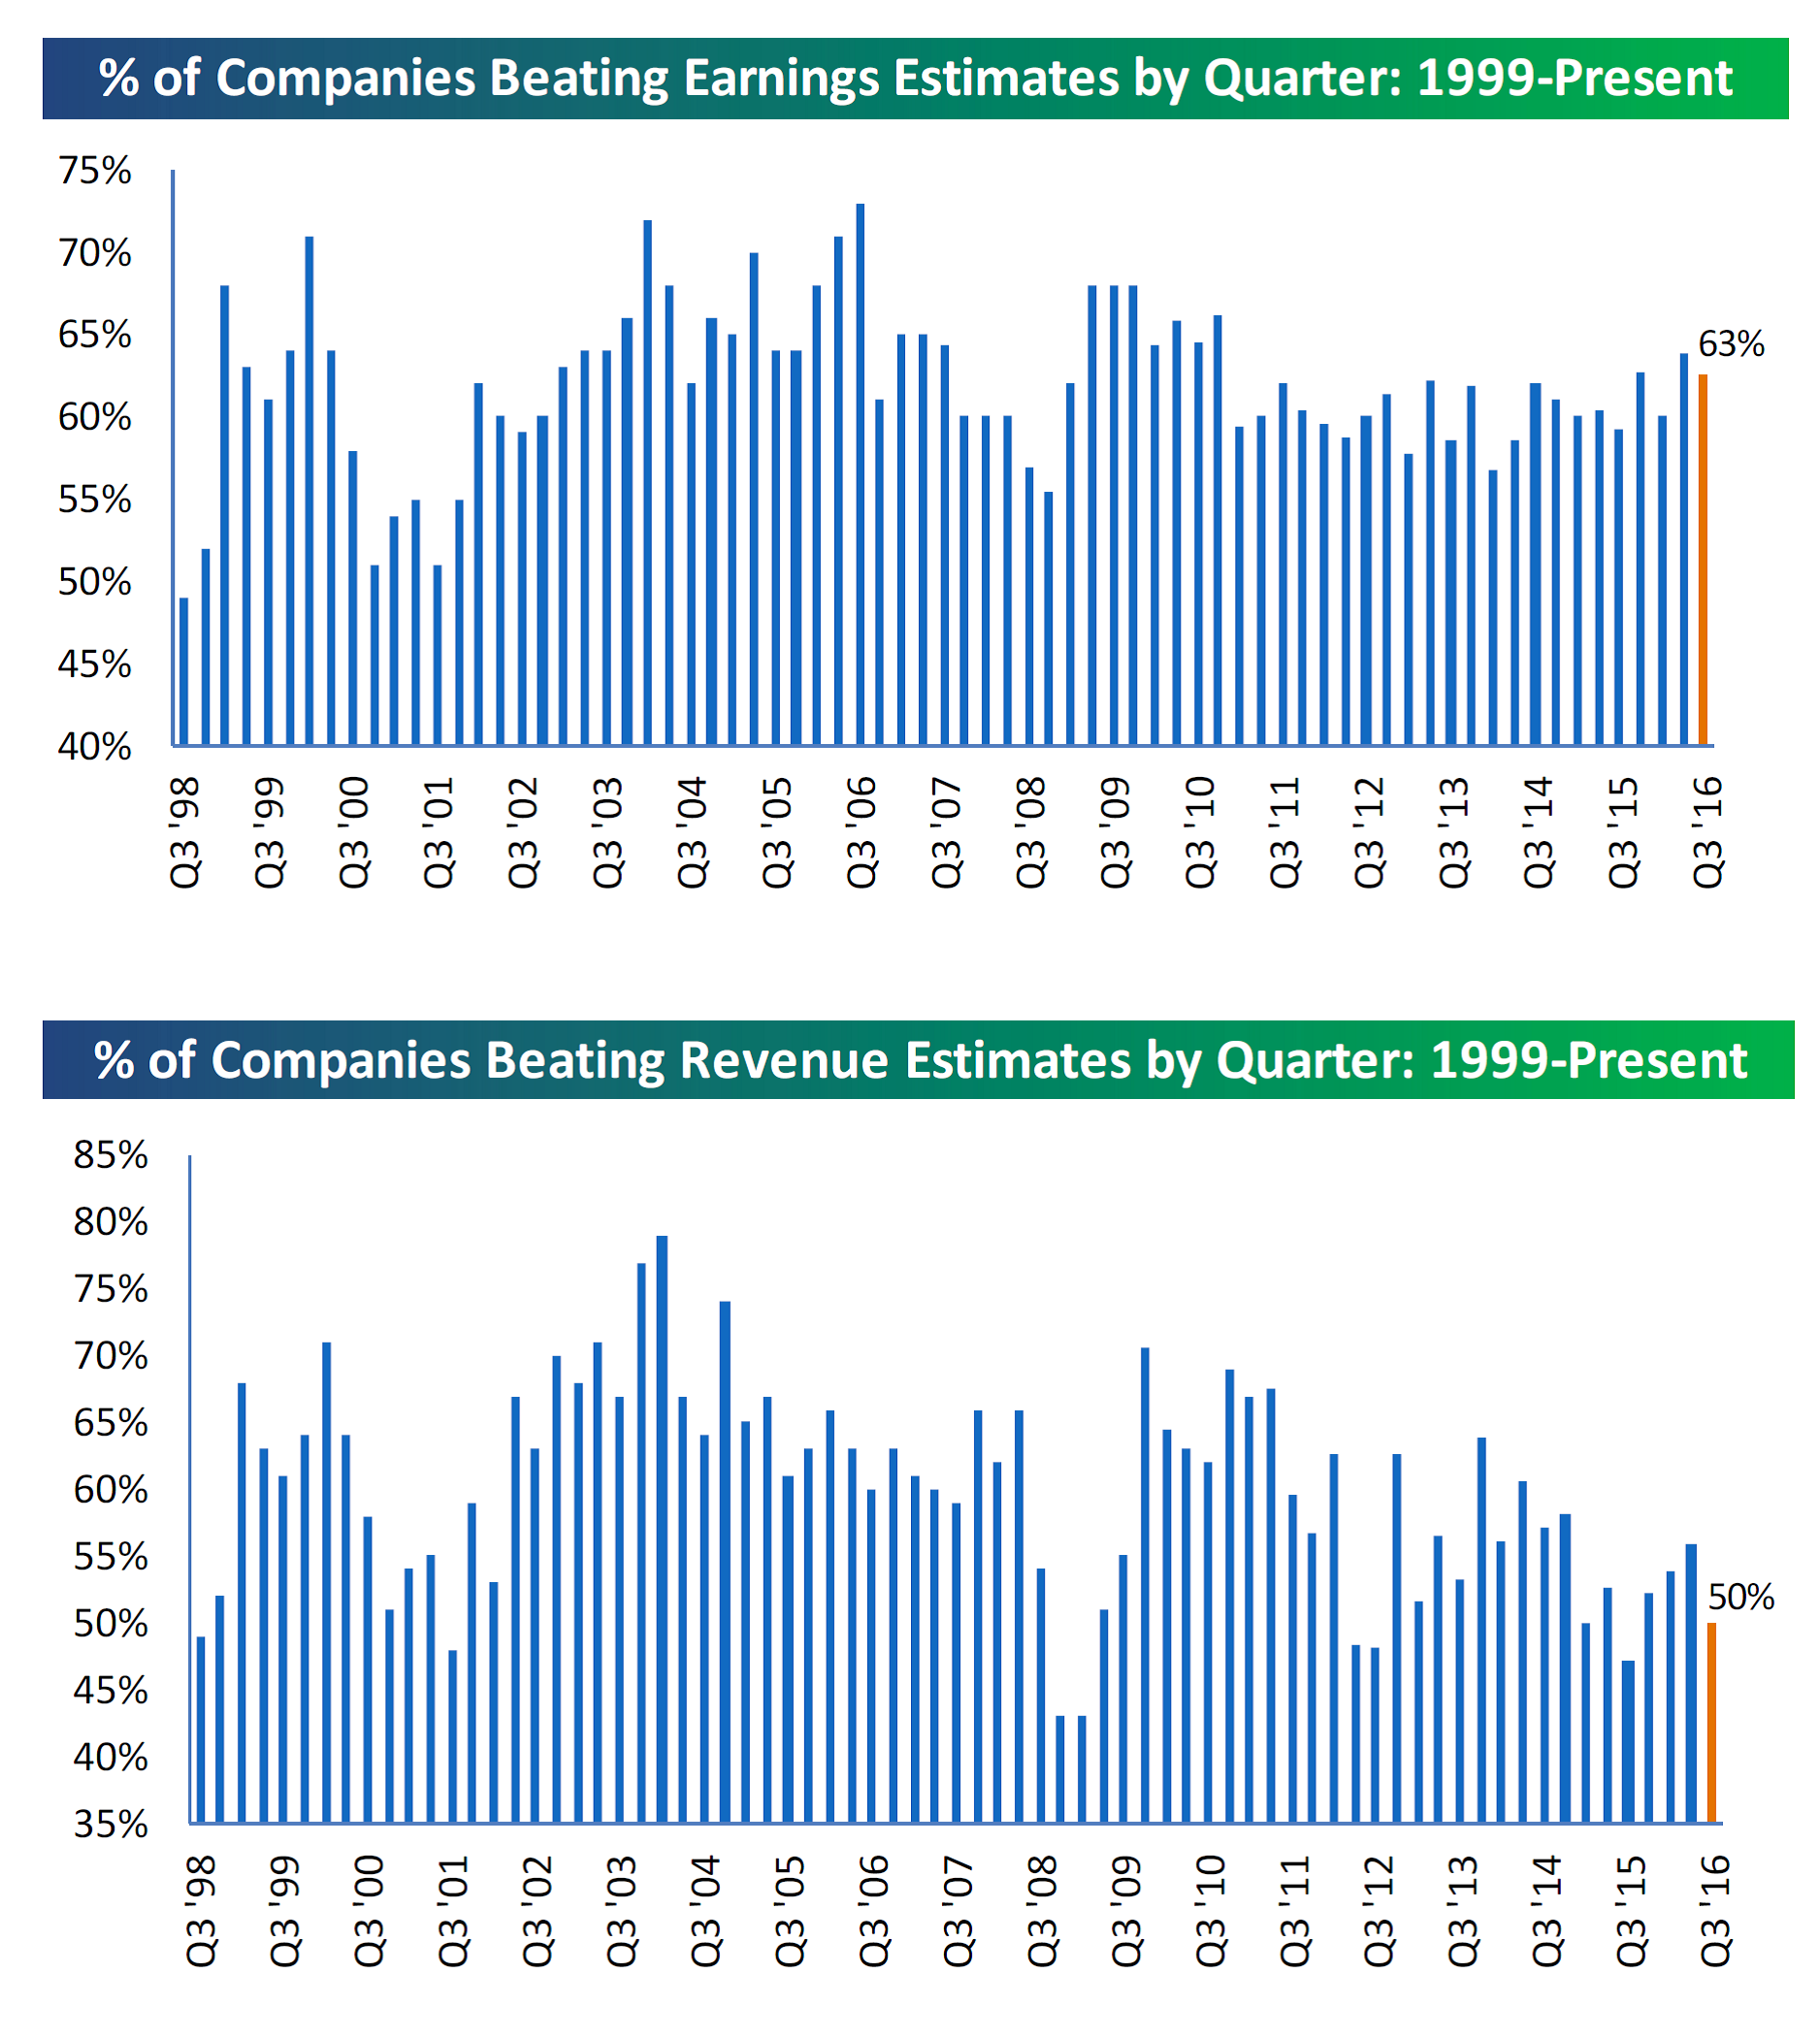
Jobs
The government collects numerous surveys that measure the temperature of the job market. A few suggest the labor market is quite healthy, others support the idea that we’ve witnessed solid improvement over the last six years, while others would say more progress is needed.
So to some it may seem clear as mud but one that has been particularly encouraging is the Department of Labor’s (DOL) release of Weekly Initial Jobless Claims for Unemployment Insurance. This report has several slang names such as “Initial Claims”, “Unemployment Claims” and “Jobless Claims” but this is the official title.
So here’s how it works. People can’t file for weekly benefits unless they are laid off or fired. If you decide to quit a job voluntarily, you better have sweet gig lined up or at least some solid prospects or else you are going to be living out of money you have in the bank.
Last Thursday, the DOL’s weekly release showed that first-time claims fell to a 43-year low for the week ended October 8 (the most current available). First time claims are exactly what they sound like.
That’s pretty impressive. In fact, it’s even more impressive given that the population and labor force (not to be confused with the labor force participation rate) are much larger today than they were back in the early 1970s. I’m talking about the pure numbers of people.
Here’s a quick review of the numbers from the St. Louis Federal Reserve—
• The second week in a row below 250,000 (current reading of 246,000). It was expected to come in at 253,000.
• 84 weeks below 300,000, the longest streak on record
• 106 of 109 weeks below 300,000
• Compares to 108 out of 110 weeks below 300,000 in 1971 – 1973
It’s important because a low level of layoffs signals businesses are reluctant to lose employees amid improving business conditions. You can see Weekly Initial Jobless Claims in the chart below.
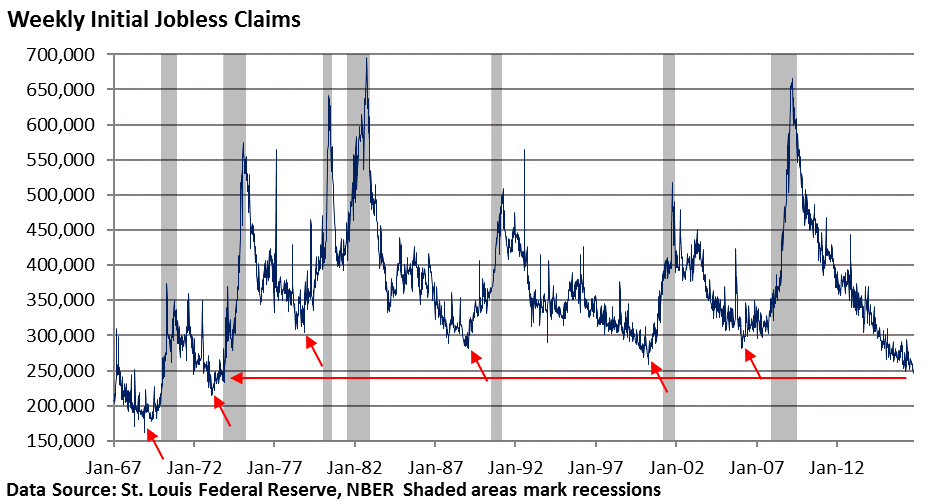
Last Date: 10.8.16
It’s also important because this leading economic indicator typically bottoms well before a recession ensues. With the exception of the very short expansion sandwiched in between the 1980 and 1982 recessions, we typically see claims bottom at least one year prior to the onset of a recession.
No two economic expansions are exactly alike, but the very low level of layoffs continues to support our thought that while GDP is growing at a very tepid pace, the economy is still growing and expanding.
It also suggests to me that a recession is unlikely in the near term.
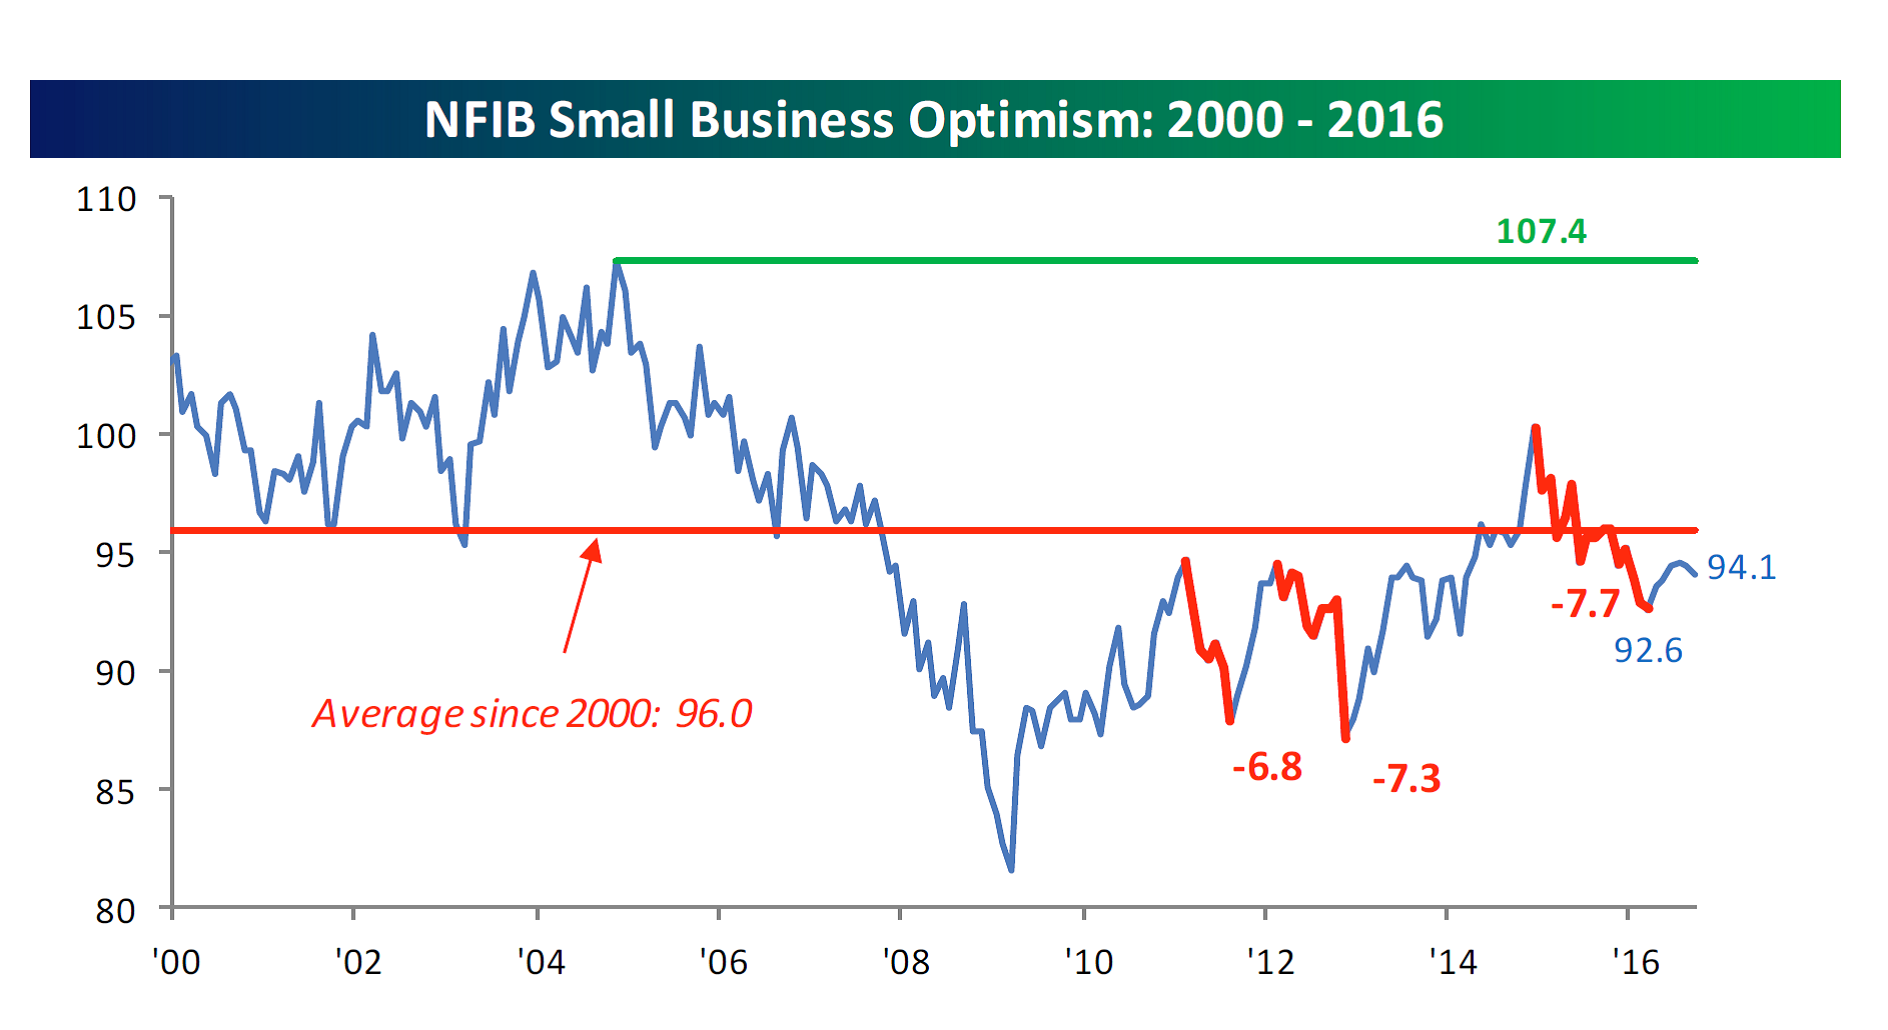
The reality is that people just don’t “feel good” about a tepid economy. Last week there was some data in the NFIB Small Business Optimism index that was released that shows, well, the optimism of small businesses.
Turns out the biggest problems facing small businesses are still “taxes” and “red tape” however “quality of labor” and “cost of labor” issues are increasingly becoming problematic. More Bespoke charts.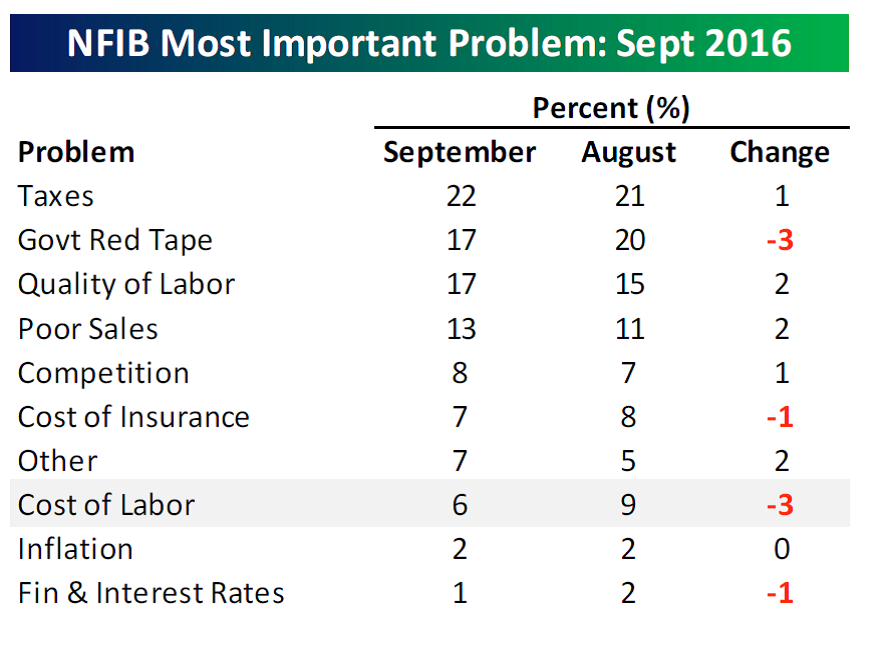
Things are going to be choppy over earnings season and until the election. I still don’t see data that points to a recession but I do think there is a good chance that we continue to see very tepid economic growth. If you are already invested, I think the best move is to hold what you’ve got. If you are sitting on cash, it may be a good idea to wait to see if a buying opportunity presents itself after the election.
Please drop me an email with any questions – I’m currently at the Fidelity Conference checking out all the new cool financial industry technology and will be back in the office on Thursday.
Important Disclosure Information
Please remember that past performance may not be indicative of future results. Different types of investments involve varying degrees of risk, and there can be no assurance that the future performance of any specific investment, investment strategy, or product (including the investments and/or investment strategies recommended or undertaken by Monument Wealth Management), or any non-investment related content, made reference to directly or indirectly in this blog will be profitable, equal any corresponding indicated historical performance level(s), be suitable for your portfolio or individual situation, or prove successful. All indexes referenced are unmanaged and cannot be invested into directly. The economic forecasts set forth may not develop as predicted. Due to various factors, including changing market conditions and/or applicable laws, the content may no longer be reflective of current opinions or positions. Moreover, you should not assume that any discussion or information contained in this blog serves as the receipt of, or as a substitute for, personalized investment advice from Monument Wealth Management. To the extent that a reader has any questions regarding the applicability of any specific issue discussed above to his/her individual situation, he/she is encouraged to consult with the professional advisor of his/her choosing. Monument Wealth Management is neither a law firm nor a certified public accounting firm and no portion of the blog content should be construed as legal or accounting advice. A copy of Monument Wealth Management’s current written disclosure statement discussing our advisory services and fees is available for review upon request.


David B. Armstrong, CFA
President & Co-Founder
Dave got into the industry when he discovered his passion for finance in his mid-20’s. He’s a combat veteran and served as an officer in the United States Marines Corps on both active duty and in the reserves, retiring at the rank of Lieutenant Colonel. While serving on active duty, Dave was unable to spend money on deployments, so he became a self-taught investor. Along with a few bucks cash as a bouncer, his investing performance grew to be good....
IMPORTANT DISCLOSURE INFORMATION
Please remember that past performance is no guarantee of future results. Different types of investments involve varying degrees of risk, and there can be no assurance that the future performance of any specific investment, investment strategy, or product (including the investments and/or investment strategies recommended or undertaken by Monument Capital Management, LLC [“Monument”]), or any non-investment related content, made reference to directly or indirectly in this blog will be profitable, equal any corresponding indicated historical performance level(s), be suitable for your portfolio or individual situation, or prove successful. Due to various factors, including changing market conditions and/or applicable laws, the content may no longer be reflective of current opinions or positions. Moreover, you should not assume that any discussion or information contained in this blog serves as the receipt of, or as a substitute for, personalized investment advice from Monument. To the extent that a reader has any questions regarding the applicability of any specific issue discussed above to his/her individual situation, he/she is encouraged to consult with the professional advisor of his/her choosing. No amount of prior experience or success should be construed that a certain level of results or satisfaction will be achieved if Monument is engaged, or continues to be engaged, to provide investment advisory services. Monument is neither a law firm nor a certified public accounting firm and no portion of the blog content should be construed as legal or accounting advice.
A copy of the Monument’s current written disclosure Brochure discussing our advisory services and fees is available for review upon request or at www.monumentwealthmanagement.com/disclosures. Please Note: Monument does not make any representations or warranties as to the accuracy, timeliness, suitability, completeness, or relevance of any information prepared by any unaffiliated third party, whether linked to Monument’s website or blog or incorporated herein, and takes no responsibility for any such content. All such information is provided solely for convenience purposes only and all users thereof should be guided accordingly.
Historical performance results for investment indices, benchmarks, and/or categories have been provided for general informational/comparison purposes only, and generally do not reflect the deduction of transaction and/or custodial charges, the deduction of an investment management fee, nor the impact of taxes, the incurrence of which would have the effect of decreasing historical performance results. It should not be assumed that your Monument account holdings correspond directly to any comparative indices or categories. Please Also Note: (1) performance results do not reflect the impact of taxes; (2) comparative benchmarks/indices may be more or less volatile than your Monument accounts; and, (3) a description of each comparative benchmark/index is available upon request.
Please Remember: If you are a Monument client, please contact Monument, in writing, if there are any changes in your personal/financial situation or investment objectives for the purpose of reviewing/evaluating/revising our previous recommendations and/or services, or if you would like to impose, add, or to modify any reasonable restrictions to our investment advisory services. Unless, and until, you notify us, in writing, to the contrary, we shall continue to provide services as we do currently. Please Also Remember to advise us if you have not been receiving account statements (at least quarterly) from the account custodian.