Explore Our
“Off The Wall” Blog
Unique, straight-forward, unfiltered opinion on topics of concern for individuals with newfound wealth.
Patience

No blog for the past two weeks – I gave my fingers and most everything else a rest so I could take a vacation. The only thing I didn’t rest was my crappy golf game, but it was nice to get outside in some warmer weather and practice up. Especially since the sure-to-be-mounting invitations from people belonging to local clubs should reach two to three by September. One thing I did do over vacation was take a rest from the business reading and instead dove into a book recommended a few years back by a loyal client titled, The Admirals. Even though I’m just a little over half way done, it’s amazing to read about how these men grew up through the Spanish-American War to lead our Navy through WWII. I recommend it, especially after I returned home and all I could read about was the word PATIENCE from the Fed meeting.
The hardest part of being an investor is to look at the long run and stick to a plan. The current news media bombards everyone with so much information that it creates the illusion that you can actually see something coming and make adjustments to your portfolio… and the most common action we see investors engaging in is trying to get out and back into the market.
Below is a one of the great charts from JP Morgan Asset Management. As it states in the box with blue text, “Six of the 10 best days [in the market] occurred within two weeks of the 10 worst days.”
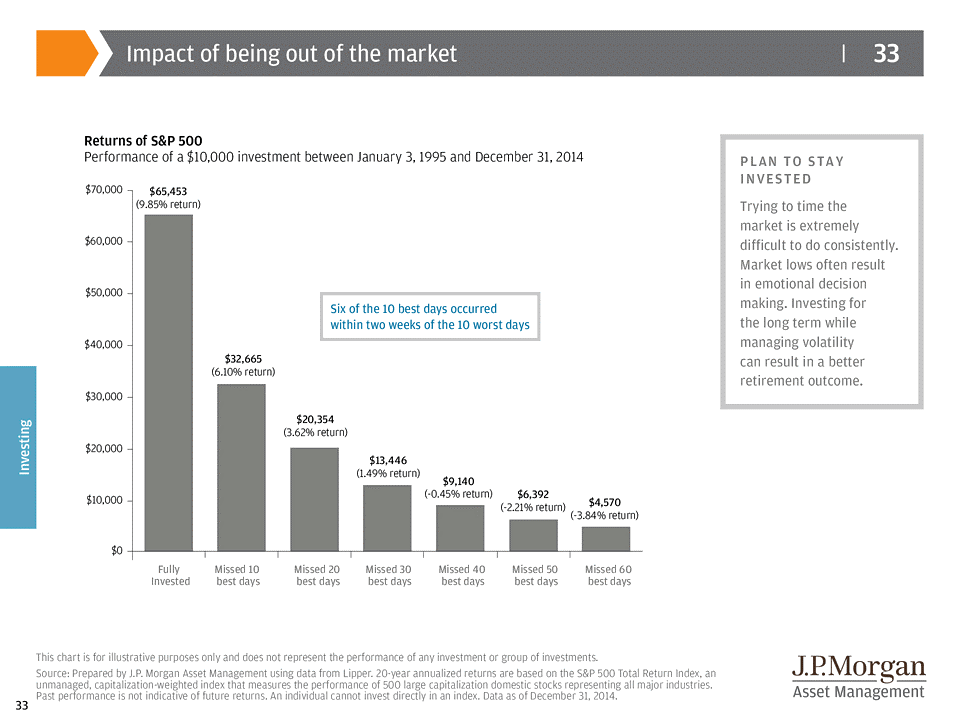
Now think about that in the context of getting in and out of the market. You are watching CNBC (because your NCAA brackets are busted) and the market has really sold off. You think, “everyone keeps talking about how the market is overvalued and with this big sell-off, I’m not sitting around waiting for the next 2008,” so you sell. Everything.
Well, you had a 50/50 chance of being right and you still have to decide when to get back in, which is another 50/50 proposition. So good luck with that… AND, you have a really good chance of missing one of the best days in the market. Look at the return difference between being fully invested and missing the 10, 20, and 30 best days in the market. It’s HARDLY insignificant.
Relative to the above, forget the idea of trying to pick portfolio managers if you are the kind of investor who is getting in and out of the market… don’t waste your time with that if you can’t even discipline yourself to stay fully invested and follow a plan.
Is the Market Overheated and Due for a Sell-off?
There is a lot of talk about the market being at an all-time high. I’ll have a quick answer for you further down, but let’s set the stage. First, take a look at this chart, below. My opinion of this chart, VISUALLY, is that the market looks high and it’s kind of scary. It shows today (roughly) and the last two peaks in the market, which were March of 2000 and October of 2007. Optically, it looks like this peak is almost twice as high as the two previous peaks. But that’s not the story. The story is in the forward P/E ratios. Notice that the 2000 forward P/E was 25.6x and in 2007 it was 15.2x. Without getting to into a huge financial explanation, think of the P/E ratio as a good way to look at the overall affordability of the market.
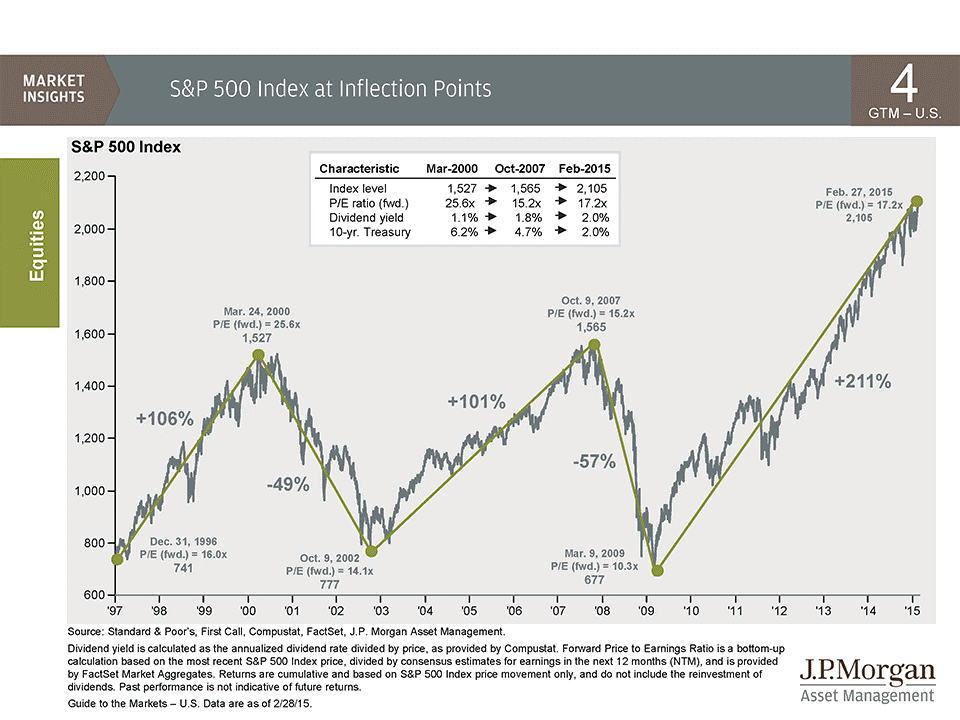
2000 = 25.6x
2007 = 15.2x
February of 2015 = 17.2x
The 211% rebound off the 2009 low in the S&P 500 is unbelievable. However, with a current forward P/E of 17.2x versus 15.2x from the previous high AND versus 25.6x from back when online pet stores (with nothing more than a sock puppet on the balance sheet) were all the rage, I don’t think it’s all that shocking.
Now, let’s look at it in another graphical form. Look at the graph on the lower left titled S&P 500 Index: Forward P/E.
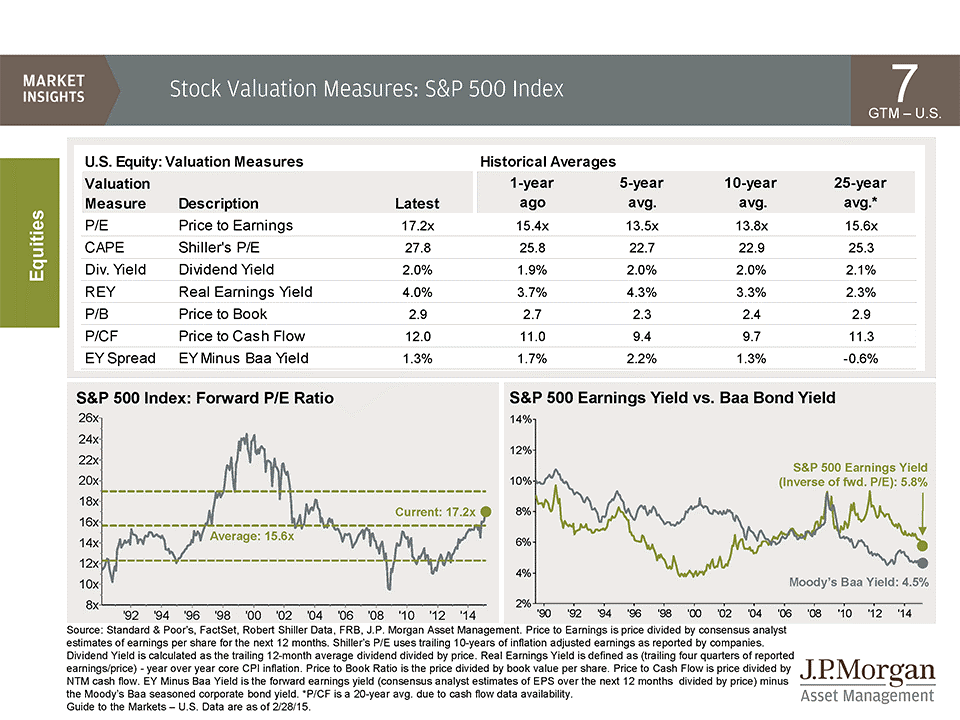
See the three green dotted lines? The middle dotted line is the 25-year average forward P/E at 15.6x and the current 17.2x is plotted at the end of the solid line. Still look scary? Not so much, in my opinion.
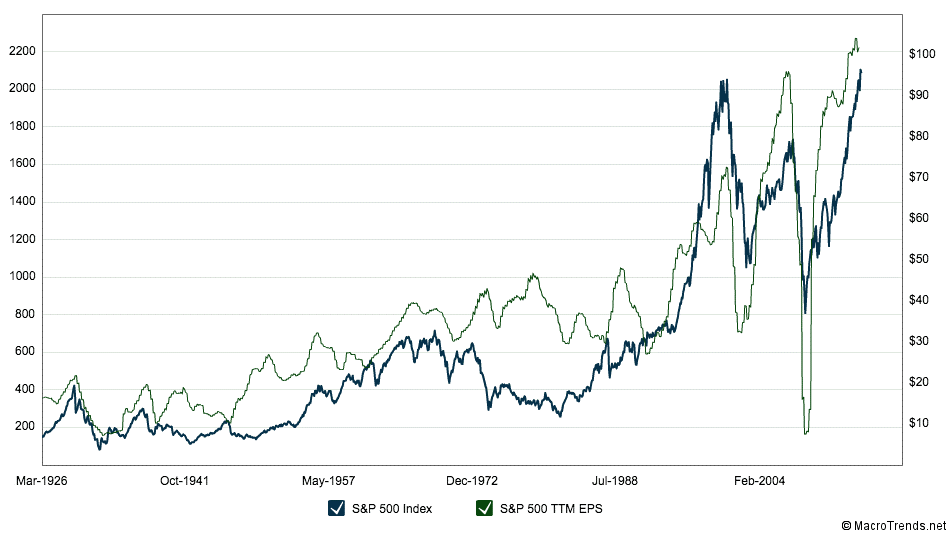
One more chart, this time from MacroTrends. The S&P 500 index is plotted in the dark blue and the trailing 12 months of earnings are in light green. See earnings move off the bottom from around $10 to up over $100? That’s got a lot to do with the S&P 500 being up over 210% off the bottom in March of 2009.
Let me flip back to patience real quick. It amazes me that the five 5-Star Admirals in the book, The Admirals, were able to run and win the naval battles in the Pacific in the 1940s. Radar was brand new, planes flew by dead reckoning, ships navigated by paper charts and the stars, radios were still new, information was hardly complete, the Japanese fleet was able to sneak up on Hawaii and launch a surprise attack… and the list goes on and on.
Today, I’m getting impatient if it takes more than 30 seconds to download the next episode of House of Cards on Netflix, or if I can’t reload my NCAA bracket standing inside of 10 seconds. Let’s not even compare my ability to track a FedEx package to within an inch of its actual location against the inability of the U.S. to track an entire Japanese strike force of six aircraft carriers, two battleships, three cruisers, nine destroyers and +400 airplanes.
So yeah, it’s easy to be impatient. I get it. But fight it… and fight the urge to think that just because the market is at an all-time high it means it will sell off any day.
With the Dow currently over 18,000, look back to the 1988 time frame and see what happened when the Dow was in the mid 4,000’s:
5,000 was a new high.
6,000 was a new high.
7,000… 8,000… 9,000… 10,000 (remember that?!)… 11,000… 12,000… 13,000… 14, 15, 16, 17 and now 18,000… they were all new highs.
You get the point. When you look at the difference between returns when missing the “’X’ Best Days,” you can see how easy it is to do damage to your portfolio.
Patience… and I’ll take my own advice too. Especially on the golf course.

Important Disclosure Information
Please remember that past performance may not be indicative of future results. Different types of investments involve varying degrees of risk, and there can be no assurance that the future performance of any specific investment, investment strategy, or product (including the investments and/or investment strategies recommended or undertaken by Monument Wealth Management), or any non-investment related content, made reference to directly or indirectly in this blog will be profitable, equal any corresponding indicated historical performance level(s), be suitable for your portfolio or individual situation, or prove successful. Due to various factors, including changing market conditions and/or applicable laws, the content may no longer be reflective of current opinions or positions. Moreover, you should not assume that any discussion or information contained in this blog serves as the receipt of, or as a substitute for, personalized investment advice from Monument Wealth Management. To the extent that a reader has any questions regarding the applicability of any specific issue discussed above to his/her individual situation, he/she is encouraged to consult with the professional advisor of his/her choosing. Monument Wealth Management is neither a law firm nor a certified public accounting firm and no portion of the blog content should be construed as legal or accounting advice. A copy of Monument Wealth Management’s current written disclosure statement discussing our advisory services and fees is available for review upon request.

David B. Armstrong, CFA
President & Co-Founder
Dave got into the industry when he discovered his passion for finance in his mid-20’s. He’s a combat veteran and served as an officer in the United States Marines Corps on both active duty and in the reserves, retiring at the rank of Lieutenant Colonel. While serving on active duty, Dave was unable to spend money on deployments, so he became a self-taught investor. Along with a few bucks cash as a bouncer, his investing performance grew to be good....
IMPORTANT DISCLOSURE INFORMATION
Please remember that past performance is no guarantee of future results. Different types of investments involve varying degrees of risk, and there can be no assurance that the future performance of any specific investment, investment strategy, or product (including the investments and/or investment strategies recommended or undertaken by Monument Capital Management, LLC [“Monument”]), or any non-investment related content, made reference to directly or indirectly in this blog will be profitable, equal any corresponding indicated historical performance level(s), be suitable for your portfolio or individual situation, or prove successful. Due to various factors, including changing market conditions and/or applicable laws, the content may no longer be reflective of current opinions or positions. Moreover, you should not assume that any discussion or information contained in this blog serves as the receipt of, or as a substitute for, personalized investment advice from Monument. To the extent that a reader has any questions regarding the applicability of any specific issue discussed above to his/her individual situation, he/she is encouraged to consult with the professional advisor of his/her choosing. No amount of prior experience or success should be construed that a certain level of results or satisfaction will be achieved if Monument is engaged, or continues to be engaged, to provide investment advisory services. Monument is neither a law firm nor a certified public accounting firm and no portion of the blog content should be construed as legal or accounting advice.
A copy of the Monument’s current written disclosure Brochure discussing our advisory services and fees is available for review upon request or at www.monumentwealthmanagement.com/disclosures. Please Note: Monument does not make any representations or warranties as to the accuracy, timeliness, suitability, completeness, or relevance of any information prepared by any unaffiliated third party, whether linked to Monument’s website or blog or incorporated herein, and takes no responsibility for any such content. All such information is provided solely for convenience purposes only and all users thereof should be guided accordingly.
Historical performance results for investment indices, benchmarks, and/or categories have been provided for general informational/comparison purposes only, and generally do not reflect the deduction of transaction and/or custodial charges, the deduction of an investment management fee, nor the impact of taxes, the incurrence of which would have the effect of decreasing historical performance results. It should not be assumed that your Monument account holdings correspond directly to any comparative indices or categories. Please Also Note: (1) performance results do not reflect the impact of taxes; (2) comparative benchmarks/indices may be more or less volatile than your Monument accounts; and, (3) a description of each comparative benchmark/index is available upon request.
Please Remember: If you are a Monument client, please contact Monument, in writing, if there are any changes in your personal/financial situation or investment objectives for the purpose of reviewing/evaluating/revising our previous recommendations and/or services, or if you would like to impose, add, or to modify any reasonable restrictions to our investment advisory services. Unless, and until, you notify us, in writing, to the contrary, we shall continue to provide services as we do currently. Please Also Remember to advise us if you have not been receiving account statements (at least quarterly) from the account custodian.