Explore Our
“Off The Wall” Blog
Unique, straight-forward, unfiltered opinion on topics of concern for individuals with newfound wealth.
This is a Honey Badger Market.

Whoa, watch out says that bird! Ewww, it’s chasing a Jackal! Oh it’s got a Cobra…oh it runs backwards…watch it dig. You do all the work for us Honey Badger and we’ll just swoop in and pick up the scraps…
This market just seems to take what it wants.
If you don’t get the joke you’ll need to watch the viral video where Randall does a hilarious voiceover to a video on the honey badger that was originally a National Geographic special on the naturally ornery critters. I’ll warn you that it’s rife with F-bombs and other four letter words…but I’ll also assure you that every 14-year-old you know has seen it multiple times and it made my Mom laugh, too. So if you need a benchmark for levels of inappropriateness, there’s that.
I wrote a blog on Friday that was about corrections – if you missed it you can read it here. But I did some more reading over the weekend and I’ve got some more thoughts below on sell-offs and 20% corrections.
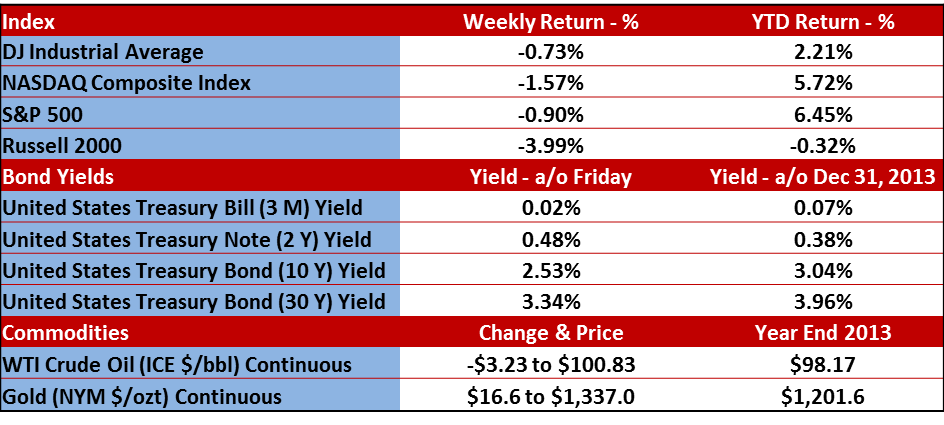
While the markets sold off a little last week, they are still trending up and as I write this blog, the S&P 500 is trading up about 0.50% for the day. Here’ s how the markets did for the week.
Bull markets are generally classified as any time the markets move 20% or more without a 20% correction. Bear markets are anytime the markets corrects 20%. So with that, it’s safe to say that we have been in a Bull Market since March of 2009. But if you remember back to 2011, we came REALLY CLOSE to that threshold of 20%. In fact, by October 3rd of 2011, the S&P 500 fell 19.38% from its CLOSING high set on April 29th, 2011.
Now if you look at the fall from the INTRDAY high on April 29th and an INTRDAY LOW on October 3rd, it was a 21.58% fall…passing through the 20% threshold for a bear market.
Yeah, yeah, yeah….details, details, details…
However, the market DID MOVE over 20% down so now in 2013, should we consider the start of the current Bull Market as 2009 or late 2011? Is the current run really all that “long in the tooth?”
I don’t have an answer, I’m just pointing it out because at the end of the day it may not matter. If we look back to 2009 as the start of the S&P 500 Bull Market, it was at 1942 days long on July 3rd. So while that is certainly long and strong (did you immediately start to add Sir Mix-A-Lot lyrics into that sentence?), it is only the 4th longest in history, according to Bespoke Group.
The longest? 4,494 days without a 20% correction…1987 to 2000.
One more thing about the market getting long in the tooth – there are a lot of other popular indices that DID have a +20% correction (based on closing process) in 2011. For example, the S&P 400 MidCap index (-27.94%), the Russell 1000 Large Cap index (-20.31%) and the Russell 2000 Small Cap index (-29.56%).
So maybe the current market is not as long as most people are saying. Just a thought.
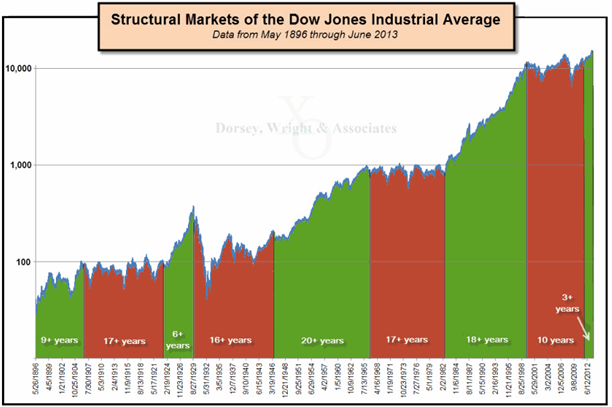
Finally, check out this chart from Dorsey Wright & Associates. Pay particular attention to the very right hand side…then note the other green sections. Good markets can last a long time.
Earnings
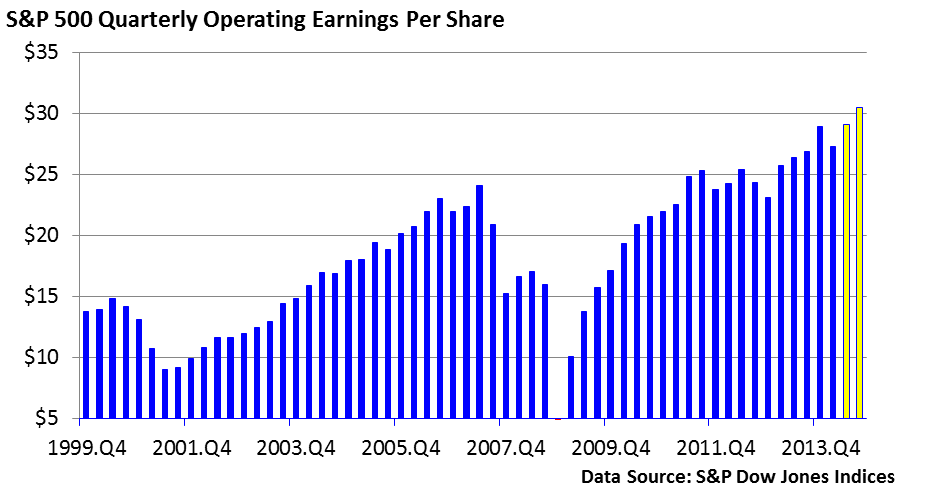
Things will start getting busier this week even though Alcoa released their earnings last week. 55 companies from the S&P 500 will report this week. According to Thomson Reuters, profits (earnings) from the second quarter are expected to grow a modest 6.1% versus one year ago. Here’s a chart that shows the S&P 500 quarterly operating earnings-per-share by quarter. Note that the light bars on the right side are forecasts for the second and third quarter. There are some ups and downs quarter-to-quarter but for the most part it’s a nice trend up from 2008.
And Finally
45 Days until you have to suffer through another college football season and my short weekly commentary on the Gamecocks.
 Important Disclosure Information
Please remember that past performance may not be indicative of future results. Different types of investments involve varying degrees of risk, and there can be no assurance that the future performance of any specific investment, investment strategy, or product (including the investments and/or investment strategies recommended or undertaken by Monument Wealth Management), or any non-investment related content, made reference to directly or indirectly in this blog will be profitable, equal any corresponding indicated historical performance level(s), be suitable for your portfolio or individual situation, or prove successful. Due to various factors, including changing market conditions and/or applicable laws, the content may no longer be reflective of current opinions or positions. Moreover, you should not assume that any discussion or information contained in this blog serves as the receipt of, or as a substitute for, personalized investment advice from Monument Wealth Management. To the extent that a reader has any questions regarding the applicability of any specific issue discussed above to his/her individual situation, he/she is encouraged to consult with the professional advisor of his/her choosing. Monument Wealth Management is neither a law firm nor a certified public accounting firm and no portion of the blog content should be construed as legal or accounting advice. A copy of Monument Wealth Management’s current written disclosure statement discussing our advisory services and fees is available for review upon request.

David B. Armstrong, CFA
President & Co-Founder
Dave got into the industry when he discovered his passion for finance in his mid-20’s. He’s a combat veteran and served as an officer in the United States Marines Corps on both active duty and in the reserves, retiring at the rank of Lieutenant Colonel. While serving on active duty, Dave was unable to spend money on deployments, so he became a self-taught investor. Along with a few bucks cash as a bouncer, his investing performance grew to be good....
IMPORTANT DISCLOSURE INFORMATION
Please remember that past performance is no guarantee of future results. Different types of investments involve varying degrees of risk, and there can be no assurance that the future performance of any specific investment, investment strategy, or product (including the investments and/or investment strategies recommended or undertaken by Monument Capital Management, LLC [“Monument”]), or any non-investment related content, made reference to directly or indirectly in this blog will be profitable, equal any corresponding indicated historical performance level(s), be suitable for your portfolio or individual situation, or prove successful. Due to various factors, including changing market conditions and/or applicable laws, the content may no longer be reflective of current opinions or positions. Moreover, you should not assume that any discussion or information contained in this blog serves as the receipt of, or as a substitute for, personalized investment advice from Monument. To the extent that a reader has any questions regarding the applicability of any specific issue discussed above to his/her individual situation, he/she is encouraged to consult with the professional advisor of his/her choosing. No amount of prior experience or success should be construed that a certain level of results or satisfaction will be achieved if Monument is engaged, or continues to be engaged, to provide investment advisory services. Monument is neither a law firm nor a certified public accounting firm and no portion of the blog content should be construed as legal or accounting advice.
A copy of the Monument’s current written disclosure Brochure discussing our advisory services and fees is available for review upon request or at www.monumentwealthmanagement.com/disclosures. Please Note: Monument does not make any representations or warranties as to the accuracy, timeliness, suitability, completeness, or relevance of any information prepared by any unaffiliated third party, whether linked to Monument’s website or blog or incorporated herein, and takes no responsibility for any such content. All such information is provided solely for convenience purposes only and all users thereof should be guided accordingly.
Historical performance results for investment indices, benchmarks, and/or categories have been provided for general informational/comparison purposes only, and generally do not reflect the deduction of transaction and/or custodial charges, the deduction of an investment management fee, nor the impact of taxes, the incurrence of which would have the effect of decreasing historical performance results. It should not be assumed that your Monument account holdings correspond directly to any comparative indices or categories. Please Also Note: (1) performance results do not reflect the impact of taxes; (2) comparative benchmarks/indices may be more or less volatile than your Monument accounts; and, (3) a description of each comparative benchmark/index is available upon request.
Please Remember: If you are a Monument client, please contact Monument, in writing, if there are any changes in your personal/financial situation or investment objectives for the purpose of reviewing/evaluating/revising our previous recommendations and/or services, or if you would like to impose, add, or to modify any reasonable restrictions to our investment advisory services. Unless, and until, you notify us, in writing, to the contrary, we shall continue to provide services as we do currently. Please Also Remember to advise us if you have not been receiving account statements (at least quarterly) from the account custodian.