Explore Our
“Off The Wall” Blog
Unique, straight-forward, unfiltered opinion on topics of concern for individuals with newfound wealth.
The Most Hated Rally I’ve Ever Seen – Here’s What Has the Market Up

I don’t know what it is, but it seems that everyone I casually chat with is sour about this rally. I’m not sure if it’s because people are in cash, if it’s because they are over-weighted to sectors that are not up as much as the market, or if it is because they are just sour about a lot of the economic data that keeps pointing to a tepid expansion.
Maybe it’s the political season.
Maybe it’s a worry that we will see the market do a repeat of 2001-2 and 2008.
Regardless, it’s tough to argue that while we have seen our dips along the way, the market has been up a lot off the March, 2009 low and the recent bounce back is remarkable.
Below, you can see Bespoke’s “Chart of the Day.” It points out that the S&P 500’s 50-day moving average is about to cross over the 200-day moving average as BOTH moving averages are increasing. It’s called a “Golden Cross.”
The Dow saw these indicators cross last week.
It is generally interpreted a bullish sign, but the bear will simply point out, “Oh yeah, what about the cross in December, 2015?” See how the 200-day moving average was declining? That’s different.
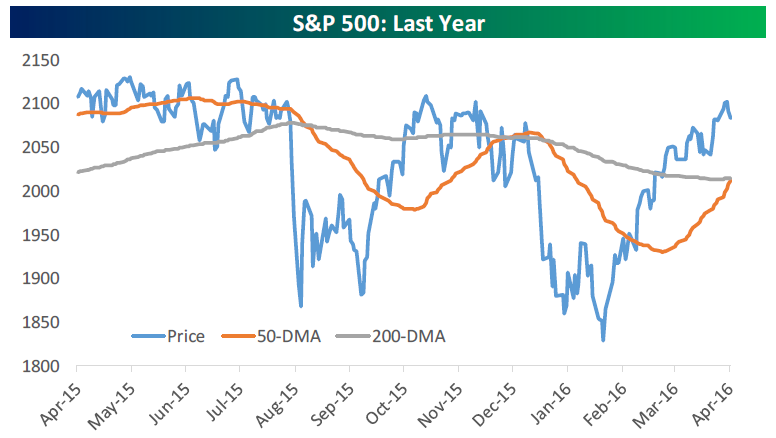
What the Bespoke data are telling us is that when a cross like this is seen, the S&P 500 is positive 50% of the time over the following week, 62.5% of the time over the next month and 75% of the time over both the next three and six months.
It has only happened 16 times since 1933 and the last one was in 2010.
You have to go all the way back to May of 1990 to find a six months mark after a cross like this where the index was negative. That’s kind of a long time ago – I should know, I had just graduated from college and been commissioned as a brand new 2nd Lt in the Marine Corps…that was pre-Desert Storm.
I point it out as interesting data AND as an observation that the market has recently rallied significantly and with some serious velocity.
It bolsters my broken record advice – if you don’t need money from your portfolio over the next 18-ish months, leave it alone because you can never predict when or how quickly the market will turn. That applies to both up and down.
Small Caps
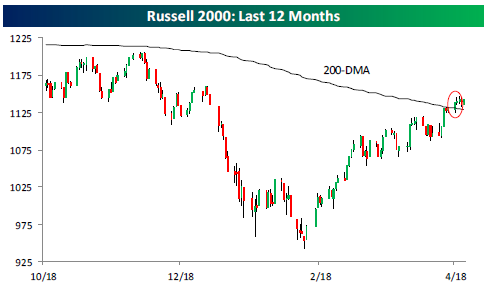
Nothing is harder or less fun than explaining why we stick with our convictions in the face of seeming wrong. Really wrong. We have not backed off our thesis that small caps are worthy of overweight, and this chart below shows that we have had to seem wrong for a long time in the face of “stealth improvement.” It’s the burden we bear when snapshots in time are used to evaluate performance. I’ve recently written about this by referring to “crossing state lines” on a drive from D.C. to Miami which you can find here.
After 167 consecutive days trading below its 200-day moving average, the Russell 2000 (the most commonly referred to index for small caps) has broken back through that moving average. That’s the longest amount of days since 1979. The Russell 2000 is now up 20.23% off its February 11th closing. Don’t look now folks, but that’s technically a bull market point for this index that was previously in a bear market.
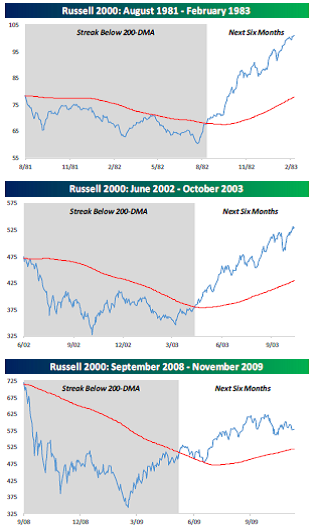
Want to see what has historically happened after the Russell 2000 has gone over 150 days below its 200-day moving average then crossed it? Nothing is a guarantee, but here are the charts (again, from Bespoke).
Of course now that I’ve mentioned all of this, I hope I have not jinxed it…keep your fingers crossed. (Get it?)
Why Are Markets Higher?
It’s most likely a combo of a few things:
- Oil prices are up. Higher crude has aided the market and should support the earnings of energy producers. Also, it quells the worries in the high-yield bond market too.
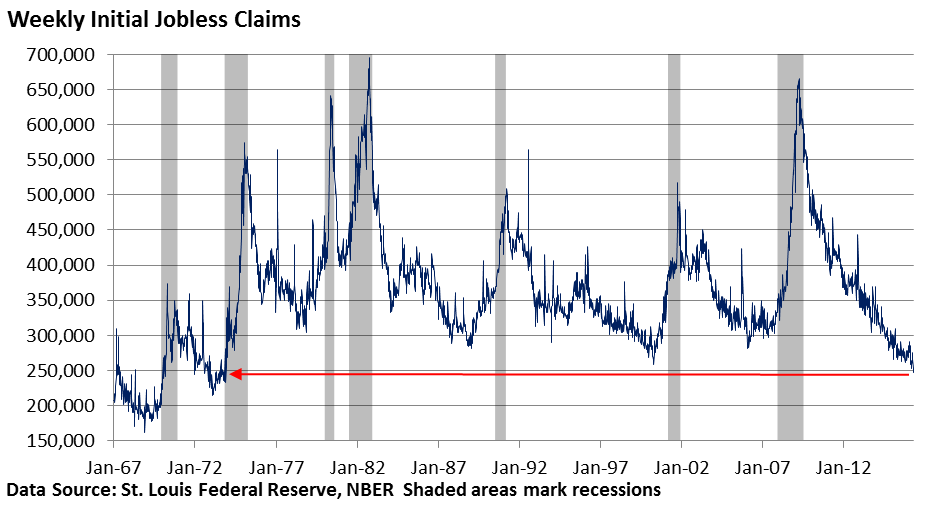
- Recession fears have really subsided. It seems like yesterday I was making our first quarter video about how we don’t see the signs of a recession unless there is clear over-borrowing, over-spending and over-confidence. I know there are a number of economic indicators that still point to tepid growth, but weekly jobless claims have fallen to the lowest level since 1973. More on job stuff below.
- As a follow-on to #2, if economic conditions were considerably declining, we’d probably be seeing an increase in layoffs. This would be reflected in weekly claims for unemployment insurance increasing. The Charles Sherry chart below this list highlights that weekly claims turned higher before the onset of each recession.
- It’s still early, but first quarter profit reports are doing well versus expectations. Of course it’s easy to jump over a bar laying on the floor…but still.
- The stability of the dollar helped fuel last month’s rally. Remember, a strong dollar means that firms have to convert any sales done overseas back into the stronger U.S. Dollar when they report quarterly profits.
- The Federal Reserve has signaled an unwillingness to raise interest rates. They meet this week.
- China fears have receded. I’ve written in the past that U.S. exports to China comprise less than 1% of U.S. economic output, but China always dominates headlines, scares traders and alarms short-term investors… BUT NOT LONG-TERM INVESTORS WITH A PLAN.
Earnings
As of Friday, there have only been 309 companies who have reported out of the 1500 that will ultimately report this season. Remember, Alcoa kicks off the season and Walmart ends it. Here’s where we stand at this early stage of the first quarter reporting season.
Companies beating their revenue forecasts stand at 54%, which is slightly higher than the final number for fourth quarter, 2015 (Q4 2015). Companies beating their earnings estimates stands at 64%, which is higher than the Q4 2015 final number of 63%. While it is currently only 1% higher, and it is still early, the Q4 2015 number was actually the highest reading seen in five years, going back to Q4 2010.
Give us a call with any questions.

Important Disclosure Information for “The Most Hated Rally I’ve Ever Seen – Here’s What Has the Market Up”
Please remember that past performance may not be indicative of future results. Different types of investments involve varying degrees of risk, and there can be no assurance that the future performance of any specific investment, investment strategy, or product (including the investments and/or investment strategies recommended or undertaken by Monument Wealth Management), or any non-investment related content, made reference to directly or indirectly in this blog will be profitable, equal any corresponding indicated historical performance level(s), be suitable for your portfolio or individual situation, or prove successful. All indexes referenced are unmanaged and cannot be invested into directly. The economic forecasts set forth may not develop as predicted. Due to various factors, including changing market conditions and/or applicable laws, the content may no longer be reflective of current opinions or positions. Moreover, you should not assume that any discussion or information contained in this blog serves as the receipt of, or as a substitute for, personalized investment advice from Monument Wealth Management. To the extent that a reader has any questions regarding the applicability of any specific issue discussed above to his/her individual situation, he/she is encouraged to consult with the professional advisor of his/her choosing. Monument Wealth Management is neither a law firm nor a certified public accounting firm and no portion of the blog content should be construed as legal or accounting advice. A copy of Monument Wealth Management’s current written disclosure statement discussing our advisory services and fees is available for review upon request.

David B. Armstrong, CFA
President & Co-Founder
Dave got into the industry when he discovered his passion for finance in his mid-20’s. He’s a combat veteran and served as an officer in the United States Marines Corps on both active duty and in the reserves, retiring at the rank of Lieutenant Colonel. While serving on active duty, Dave was unable to spend money on deployments, so he became a self-taught investor. Along with a few bucks cash as a bouncer, his investing performance grew to be good....
IMPORTANT DISCLOSURE INFORMATION
Please remember that past performance is no guarantee of future results. Different types of investments involve varying degrees of risk, and there can be no assurance that the future performance of any specific investment, investment strategy, or product (including the investments and/or investment strategies recommended or undertaken by Monument Capital Management, LLC [“Monument”]), or any non-investment related content, made reference to directly or indirectly in this blog will be profitable, equal any corresponding indicated historical performance level(s), be suitable for your portfolio or individual situation, or prove successful. Due to various factors, including changing market conditions and/or applicable laws, the content may no longer be reflective of current opinions or positions. Moreover, you should not assume that any discussion or information contained in this blog serves as the receipt of, or as a substitute for, personalized investment advice from Monument. To the extent that a reader has any questions regarding the applicability of any specific issue discussed above to his/her individual situation, he/she is encouraged to consult with the professional advisor of his/her choosing. No amount of prior experience or success should be construed that a certain level of results or satisfaction will be achieved if Monument is engaged, or continues to be engaged, to provide investment advisory services. Monument is neither a law firm nor a certified public accounting firm and no portion of the blog content should be construed as legal or accounting advice.
A copy of the Monument’s current written disclosure Brochure discussing our advisory services and fees is available for review upon request or at www.monumentwealthmanagement.com/disclosures. Please Note: Monument does not make any representations or warranties as to the accuracy, timeliness, suitability, completeness, or relevance of any information prepared by any unaffiliated third party, whether linked to Monument’s website or blog or incorporated herein, and takes no responsibility for any such content. All such information is provided solely for convenience purposes only and all users thereof should be guided accordingly.
Historical performance results for investment indices, benchmarks, and/or categories have been provided for general informational/comparison purposes only, and generally do not reflect the deduction of transaction and/or custodial charges, the deduction of an investment management fee, nor the impact of taxes, the incurrence of which would have the effect of decreasing historical performance results. It should not be assumed that your Monument account holdings correspond directly to any comparative indices or categories. Please Also Note: (1) performance results do not reflect the impact of taxes; (2) comparative benchmarks/indices may be more or less volatile than your Monument accounts; and, (3) a description of each comparative benchmark/index is available upon request.
Please Remember: If you are a Monument client, please contact Monument, in writing, if there are any changes in your personal/financial situation or investment objectives for the purpose of reviewing/evaluating/revising our previous recommendations and/or services, or if you would like to impose, add, or to modify any reasonable restrictions to our investment advisory services. Unless, and until, you notify us, in writing, to the contrary, we shall continue to provide services as we do currently. Please Also Remember to advise us if you have not been receiving account statements (at least quarterly) from the account custodian.