Explore Our
“Off The Wall” Blog
Unique, straight-forward, unfiltered opinion on topics of concern for individuals with newfound wealth.
GDP, Earnings and a Victory Lap
October was a great month for stocks. The returns basically blanked the losses incurred in August and September. By month’s end, the Dow Jones Industrials recorded a gain of 8.8%, the S&P 500 Index rose 8.6% and the Russell 2000 rose 5.5%. The Dow and the S&P were the best monthly gains in four years.
Gross Domestic Product (GDP)
The initial third quarter (Q3) GDP report was weaker than expected, but there will be two more revisions. At first glance, this reading does not send a very positive message about the state of the U.S. economy. Remember, GDP is a “lookback” number for the months of July through September, while markets are forward-looking… so there is nothing to read into the fact that markets have done well while a weak GDP report is published.
GDP in the Q3 slowed to an annualized pace of 1.5%. This is off from the second quarter (Q2) reading of 3.9% and off from the consensus forecast of 1.7%. While the slowdown from the Q2 was anticipated, it’s always important to look underneath the hood of a particular quarter’s GDP report, i.e., find out what affected the number. Here’s a chart from Bespoke Research.
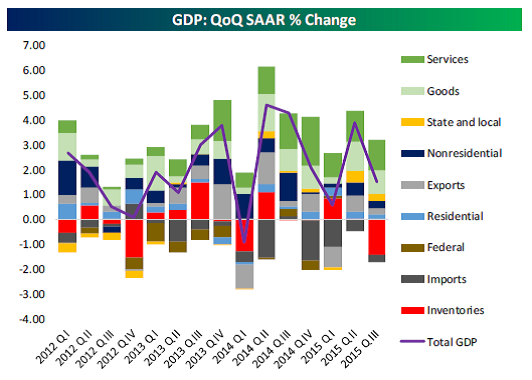
For the Q3, there was a very sharp drop in business inventories on the back of a big inventory build in the first half of the year. Without boring everyone with a long review of the formula for calculating GDP, just know that when inventories go down, it reduces GDP. This can be seen in the chart above and specifically the red portion of the Q3 2015 bar on the very right. (See how it is below the 0.00 line?) This reduction in inventories reduced the reported GDP number by 1.44 percentage points off the top-line (U.S. BEA). So basically, were it not for this large inventory swing, (I read it was the biggest swing since 2011, but I have not verified that data) we would have seen GDP expand by a respectable 3.0%.
There was a nice, moderate rise in overall consumer spending, which makes up almost 70% of GDP. Look at the Goods and Services colors on the bar in the Bespoke chart (they are the top two sections of the bar) and you will see that the consumer was just as strong in the Q3 as in the Q2. Back to back consumer spending like this (2.4% in Q2 and 2.2% in Q3) reinforces our assertion that the consumer will be spending with the break in gas prices and strengthening employment.
While the drop in inventories highlights the weakness in manufacturing, continued gains in spending are likely to assist inventory growth going forward. If spending continues, manufacturing will have to crank back up to fill inventory. This may not be the end of it though – there may still be one or even two more quarters where inventory remains an encumbrance to GDP.
The problem is that looking back at the current economic recovery (which officially began in July of 2009), we know that GDP growth has been subpar. Again, last Thursday’s release will be followed by two more revisions as more complete data roll in, so stay tuned.
So What Do We Think?
While we may sound like a song stick in your head, we think the same thing … despite the fact that there was an inventory correction, the U.S. economy remains strong albeit muted and the expansion, while seemingly unimpressive, remains intact.
I’ll be interested in the October auto sales numbers next month. With the September number showing annualized sales numbers around 18.1m, it will be interesting to see if the October report keeps this number as high as it is. I suspect it will.
Earnings
Oooooo – last week was BUSY! Almost 800 companies reported their Q3 earnings last week and over 1,200 have reported their results for the quarter.
The percentage of companies beating their revenue estimates for the Q3 of 2015 stands at 46.9% which is currently WAY below the average of the 60% that we’ve seen since 2000. It’s been a really poor showing for revenue over the past three quarters.
The percentage of companies beating their earnings estimates stands at 63%, which is now above the average of 62% dating back to 1998. Last week we stood below the average so it was a nice move to the upside over the past week. If the 63% reading holds, it will be the best reading since the Q4 of 2010.
Bespoke publishes a chart that shows the spread between companies guiding future earnings higher or lower on a percentage basis. Up until the Q1 of 2014, the spread had been negative for the TEN previous quarters, meaning there were more companies stating they would earn less in the upcoming quarter than the same quarter a year prior. That’s 2.5 years of pessimism coming out of corporate America.
After two flat quarters in the Q1 and Q2 of 2014, we saw the Q3 of 2014 revert back to a negative reading, and this reading never looked back. The current reading for the Q3 of 2015 shows that the spread between companies posting negative guidance versus companies posting positive guidance is at -4.6%. This is far from the worst spread reading which stood at -9.4% in the Q4 of 2014, which was the worst reading since the last two quarters of 2008.
Of the last 17 quarters, two were about flat and the rest were negative. It’s interesting to me that companies are guiding lower as the market goes up. If I see this invert, it will have my attention – it could be a good indicator of corporate over-confidence.
Be sure to take a few minutes to see what I say about over-spending, over-borrowing and over-confidence in the last part of a three part video series we put out over the summer. When these three things combine, it’s usually not a good sign for the economy. Right now, all three are very low.
What to Do Now
There is really nothing new to tell an investor who has a good plan. Here’s why – there is nothing for YOU to do.
Doing things is our job… we do stuff. We are accountable to you for making sure your investment strategy is meeting the goals and objectives of your plan over the long term. Which by the way, is not a month or quarter or usually even a year.
So what should you do now? The same thing we would have told you to do in 2011, 2012, and even three months ago. Have a plan, be disciplined enough to stick with it and know your need for short-term liquidity.
People who are always doing something end up doing poorly. How do I know this? Well there is an annual study called the Dalbar Study. It’s expensive so I stick to reading the articles that people write about it … but it says that in 2014, the 30-year annualized return of the S&P 500 was 11.06% versus the average asset allocation investor who realized an annualized return over the same time of 2.47%.
Do you know why? Because of psychological factors that drive poor decisions and a lack of discipline.
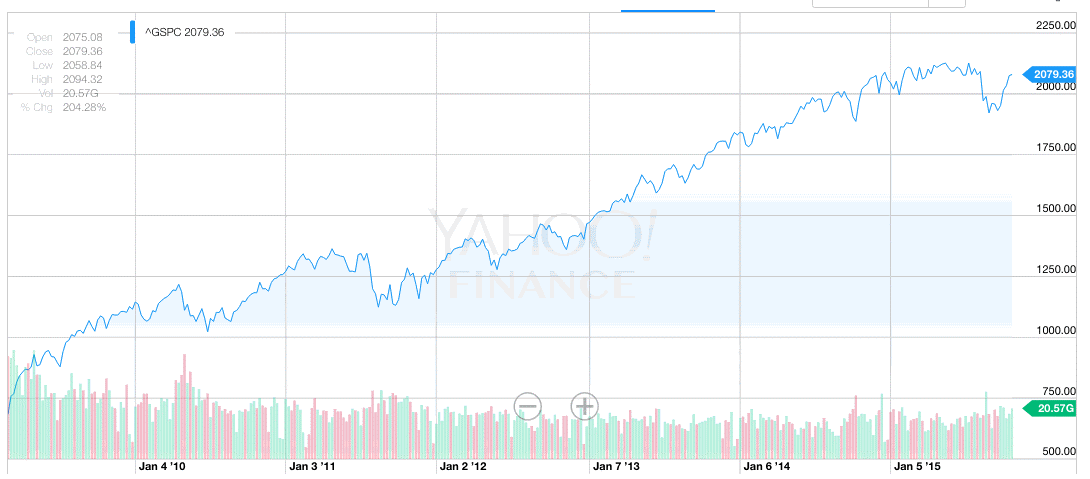
Here’s a Yahoo chart of the S&P 500 since March 9, 2009. Think about how many things have happened that the press, the market, investors and advisors could have (and probably did) react to over this time and ask yourself how bad anyone could have done by having a solid plan, a good investment strategy and the discipline to stick with it and do no harm.
S&P 500 Since March 9,2009 (Yahoo)
Victory Lap
One thing we get accused of is not taking “victory laps,” and I suppose sometimes you have to take a victory lap when you tell people what to do and you are right … right? So here are a few times we were right.
- Here’s a U.S. News and World Report article I wrote back in March of 2011 which was the two-year anniversary of the market bottom and the Fukushima Nuke Plant accident happened. I told people what to do… Mash this link
- Here’s a U.S. News and World Report article I wrote back in August of 2011. I told people what to do… Mash this here link
- Oh, how about something from summer of 2012…Mash-inate
- How about something from the end of August, 2015 when the Dow got pasted with a 1000 point decline at the open. You can find the whole blog here. Go re-read every single word in this blog … like, now. Here’s a snippet…
“You should know how much liquidity (cash) you need out of your portfolio and have it ready. You should not have to panic and ever say “What should I do now?” Have a plan and stick to it. Take a look at your fire drill now. If you don’t like it, rework your plan. It’s okay if this recent market activity got you to a point that you realize you don’t actually like the current riskiness of your portfolio. But panicking is not a way to change your plan.
If you have a plan, stick to it.
If you have long-term cash, consider investing it now.
This may not be the bottom, but if you buy right now, I know you’ll be happy with where the investment ends up five years or so from today.
Don’t listen to Charlatans or Fools … now or ever.”
Here Are Some Questions You Should Be Asking Yourself Right Now
- Now that the market has basically made up all of the summer panic sell-off, are you okay? Did it keep you from sleeping at night? If it did, have you asked yourself why?
- Did you realize that you didn’t like the riskiness of your plan when the market sold off? If so, have you now gotten lazy about fixing it because the market has rebounded? Have you called and talked to us about it?
- Did you feel like you didn’t have a good fire drill in place?
Call us. Talk to us.

Important Disclosure Information for “GDP Slows, But Look Behind the Headline”
Please remember that past performance may not be indicative of future results. Different types of investments involve varying degrees of risk, and there can be no assurance that the future performance of any specific investment, investment strategy, or product (including the investments and/or investment strategies recommended or undertaken by Monument Wealth Management), or any non-investment related content, made reference to directly or indirectly in this blog will be profitable, equal any corresponding indicated historical performance level(s), be suitable for your portfolio or individual situation, or prove successful. Due to various factors, including changing market conditions and/or applicable laws, the content may no longer be reflective of current opinions or positions. Moreover, you should not assume that any discussion or information contained in this blog serves as the receipt of, or as a substitute for, personalized investment advice from Monument Wealth Management. To the extent that a reader has any questions regarding the applicability of any specific issue discussed above to his/her individual situation, he/she is encouraged to consult with the professional advisor of his/her choosing. Monument Wealth Management is neither a law firm nor a certified public accounting firm and no portion of the blog content should be construed as legal or accounting advice. A copy of Monument Wealth Management’s current written disclosure statement discussing our advisory services and fees is available for review upon request.

David B. Armstrong, CFA
President & Co-Founder
Dave got into the industry when he discovered his passion for finance in his mid-20’s. He’s a combat veteran and served as an officer in the United States Marines Corps on both active duty and in the reserves, retiring at the rank of Lieutenant Colonel. While serving on active duty, Dave was unable to spend money on deployments, so he became a self-taught investor. Along with a few bucks cash as a bouncer, his investing performance grew to be good....
IMPORTANT DISCLOSURE INFORMATION
Please remember that past performance is no guarantee of future results. Different types of investments involve varying degrees of risk, and there can be no assurance that the future performance of any specific investment, investment strategy, or product (including the investments and/or investment strategies recommended or undertaken by Monument Capital Management, LLC [“Monument”]), or any non-investment related content, made reference to directly or indirectly in this blog will be profitable, equal any corresponding indicated historical performance level(s), be suitable for your portfolio or individual situation, or prove successful. Due to various factors, including changing market conditions and/or applicable laws, the content may no longer be reflective of current opinions or positions. Moreover, you should not assume that any discussion or information contained in this blog serves as the receipt of, or as a substitute for, personalized investment advice from Monument. To the extent that a reader has any questions regarding the applicability of any specific issue discussed above to his/her individual situation, he/she is encouraged to consult with the professional advisor of his/her choosing. No amount of prior experience or success should be construed that a certain level of results or satisfaction will be achieved if Monument is engaged, or continues to be engaged, to provide investment advisory services. Monument is neither a law firm nor a certified public accounting firm and no portion of the blog content should be construed as legal or accounting advice.
A copy of the Monument’s current written disclosure Brochure discussing our advisory services and fees is available for review upon request or at www.monumentwealthmanagement.com/disclosures. Please Note: Monument does not make any representations or warranties as to the accuracy, timeliness, suitability, completeness, or relevance of any information prepared by any unaffiliated third party, whether linked to Monument’s website or blog or incorporated herein, and takes no responsibility for any such content. All such information is provided solely for convenience purposes only and all users thereof should be guided accordingly.
Historical performance results for investment indices, benchmarks, and/or categories have been provided for general informational/comparison purposes only, and generally do not reflect the deduction of transaction and/or custodial charges, the deduction of an investment management fee, nor the impact of taxes, the incurrence of which would have the effect of decreasing historical performance results. It should not be assumed that your Monument account holdings correspond directly to any comparative indices or categories. Please Also Note: (1) performance results do not reflect the impact of taxes; (2) comparative benchmarks/indices may be more or less volatile than your Monument accounts; and, (3) a description of each comparative benchmark/index is available upon request.
Please Remember: If you are a Monument client, please contact Monument, in writing, if there are any changes in your personal/financial situation or investment objectives for the purpose of reviewing/evaluating/revising our previous recommendations and/or services, or if you would like to impose, add, or to modify any reasonable restrictions to our investment advisory services. Unless, and until, you notify us, in writing, to the contrary, we shall continue to provide services as we do currently. Please Also Remember to advise us if you have not been receiving account statements (at least quarterly) from the account custodian.