Explore Our
“Off The Wall” Blog
Unique, straight-forward, unfiltered opinion on topics of concern for individuals with newfound wealth.
Why Earnings, Charts and Oil are Important to You Right Now.

Earnings season hasn’t ended yet, but it’s really slowing down since over 2,000 companies have reported their earnings for the quarter… we’re in the home stretch. Wal-Mart (WMT) is the unofficial “closer” of the reporting period and they will announce on August 18th.
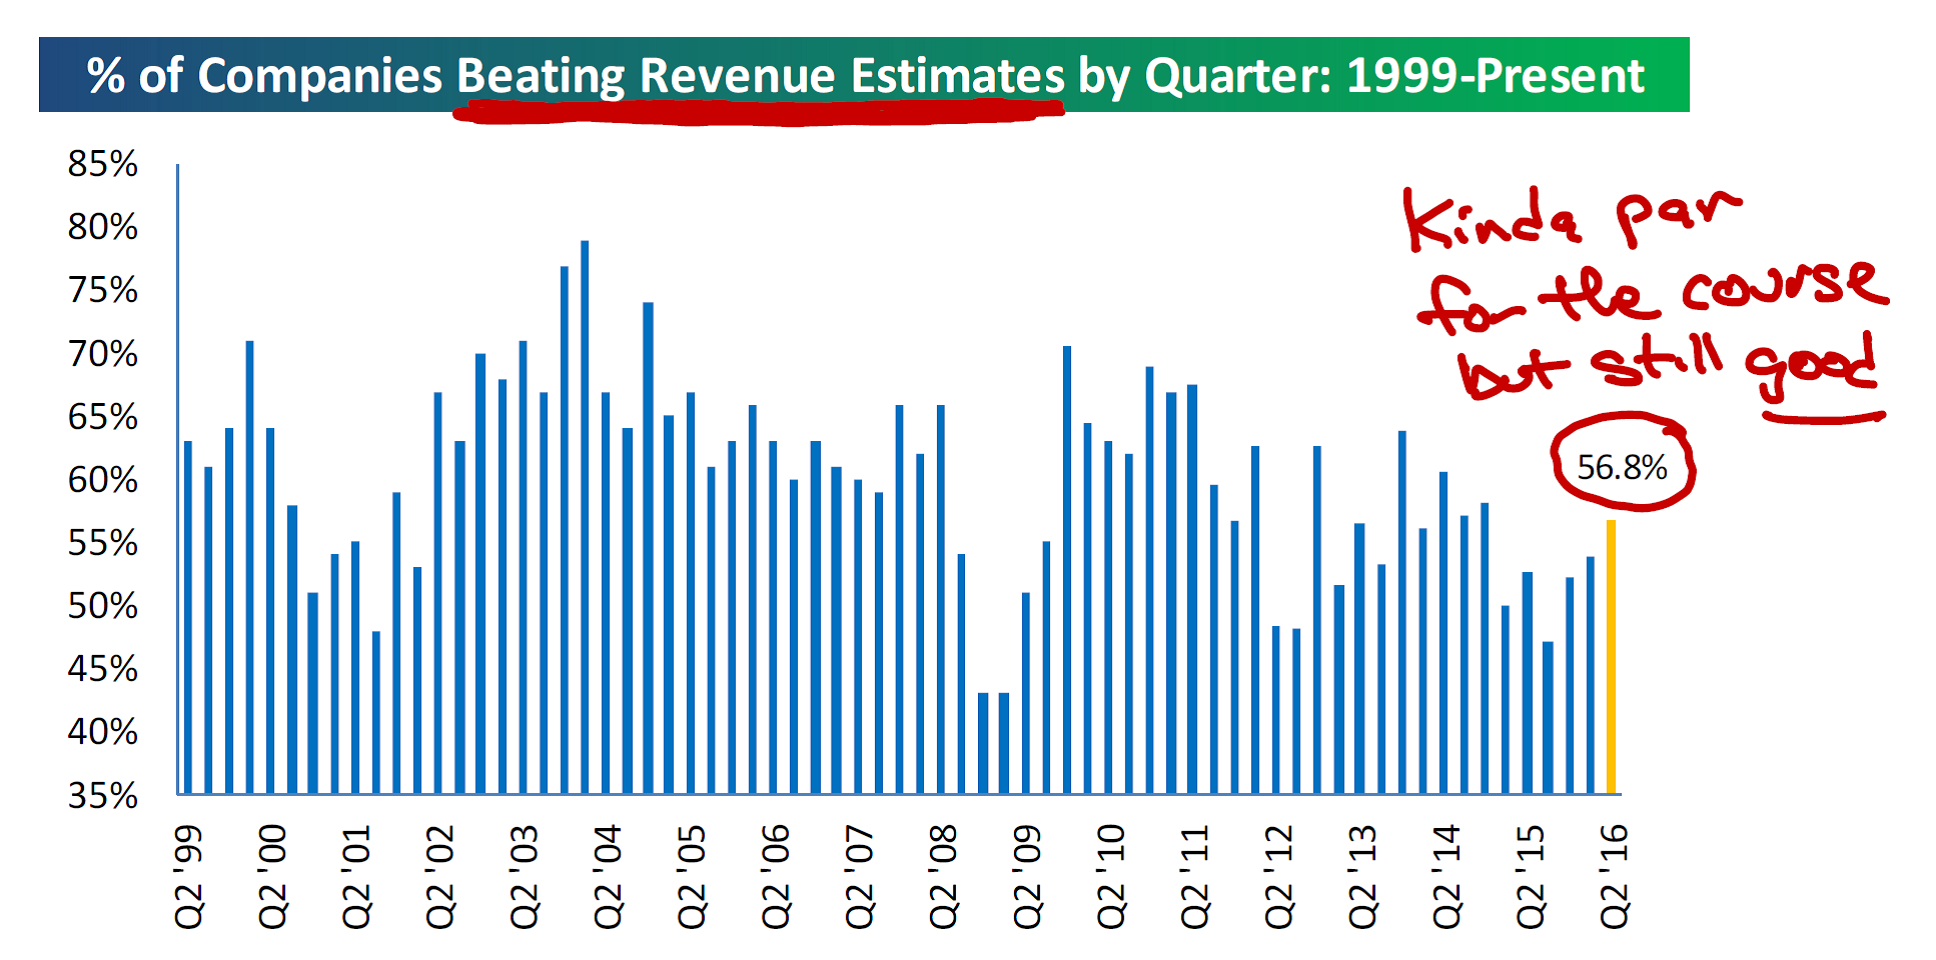
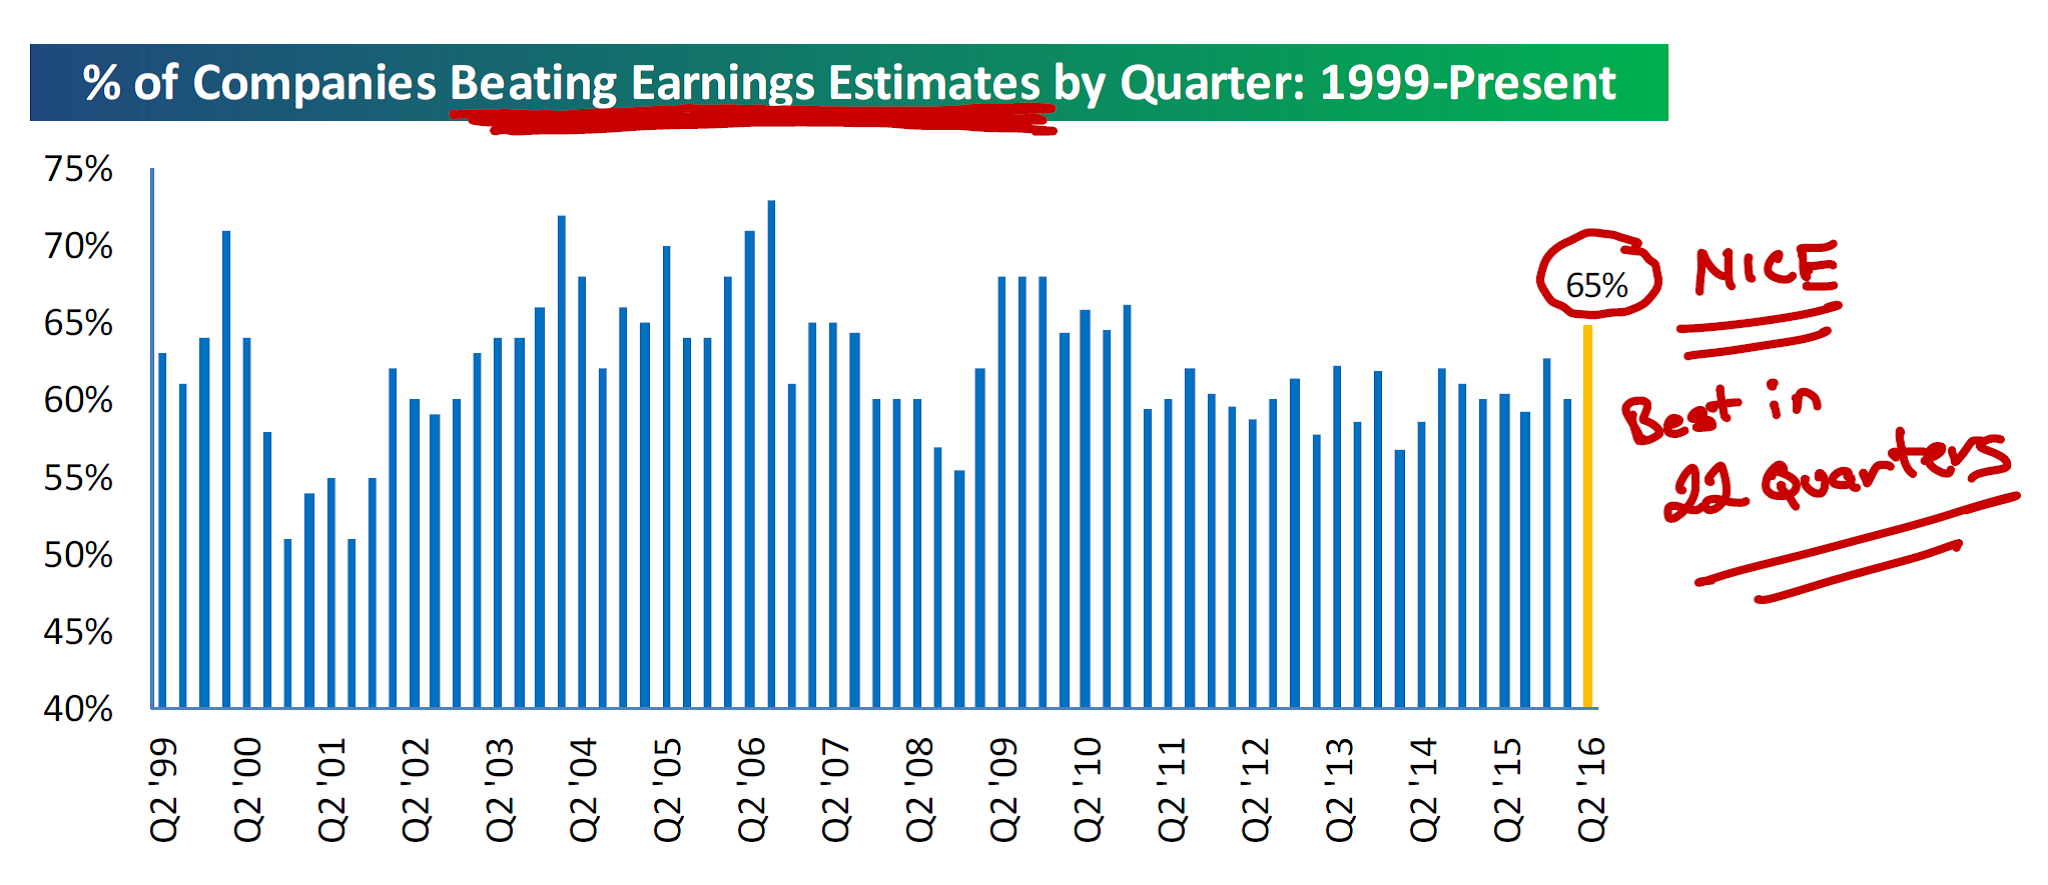
So far, most investors seem satisfied by both the earnings and the market’s response. The S&P 500 has increased by over 2% since the season began (Alcoa starts the “season” and they announced on July 11th.) As you can see in the two charts below from Bespoke, 56.8% of all companies have beaten their revenue forecasts and 65% of companies that have reported to date have beaten their earnings estimates. Not bad. As you can see by my hand written note, if earnings season ended today, the 65% beat-rate would be the strongest we’ve seen in 22 quarters!
Below is how the earnings growth rate looks according to our FactSet data for 2016. This goes all the way back to the beginning of the year at right around +6.0%. (Keep in mind that the chart looks steep, but it’s only a downward slope from +6.0% to -0.5%… If the chart showed all +100% down to -0.5%, it would not seem so steep.)
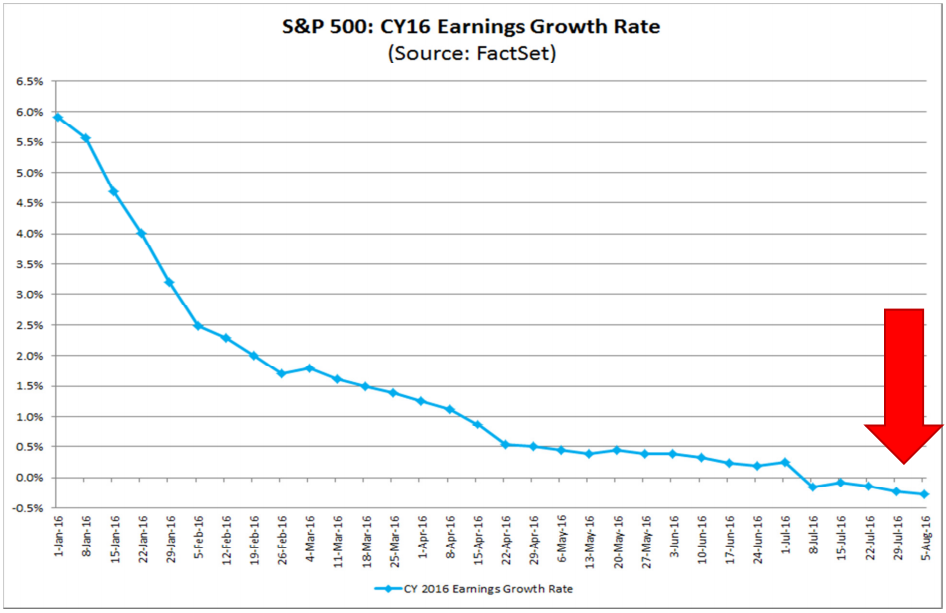
No one is excited about that, but the real culprit here is ENERGY. Energy sector earnings are estimated to fall 72% in 2016, and that’s after the 98% decline in 2015.
You can see the energy damage below…
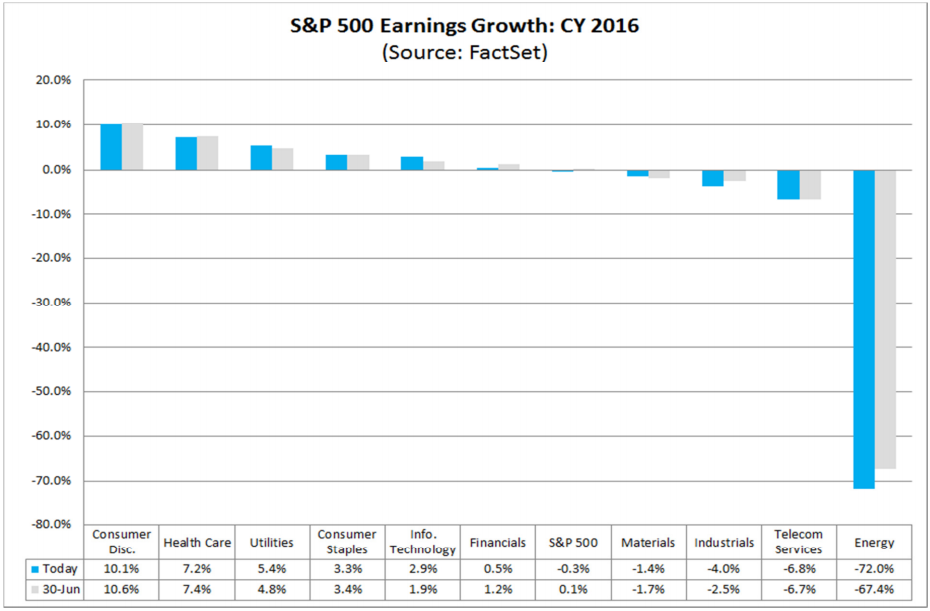
Earnings WITHOUT energy look better with S&P 500 earnings rising 2.8% in 2016. Nothing worth overly bragging about, but also NOT NEGATIVE. Since we have recently seen a decline in oil prices, there is continued pressure on the the Energy sector’s profitability.
Earnings drive the market. We need to see better earnings if we want to see the stock market continue to go up from here.
Zero Value Added
From the Department of “Zero Value Added,” you’ll see this chart below. I’m not calling out this firm, I’m just saying that this is not useful for any long-term investor… Which is you, right? (Please say yes!) My point is, don’t be an “in-guess-tor”, be an investor.
You see what I did there, right?
So in the interest of making my point, let me retool the graph to show what I think it should say…
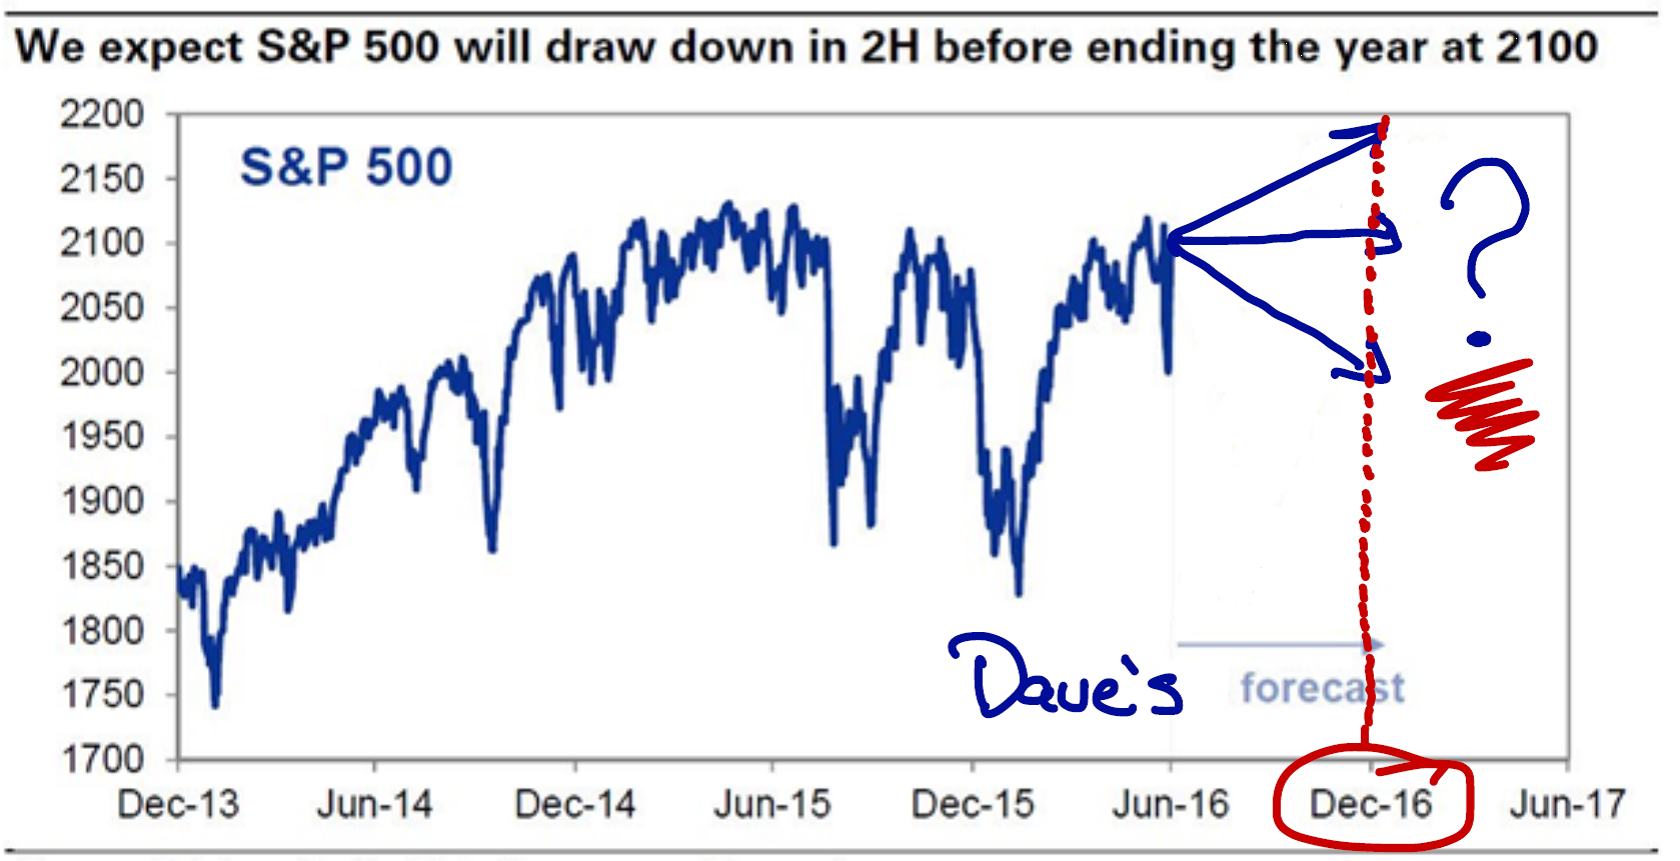
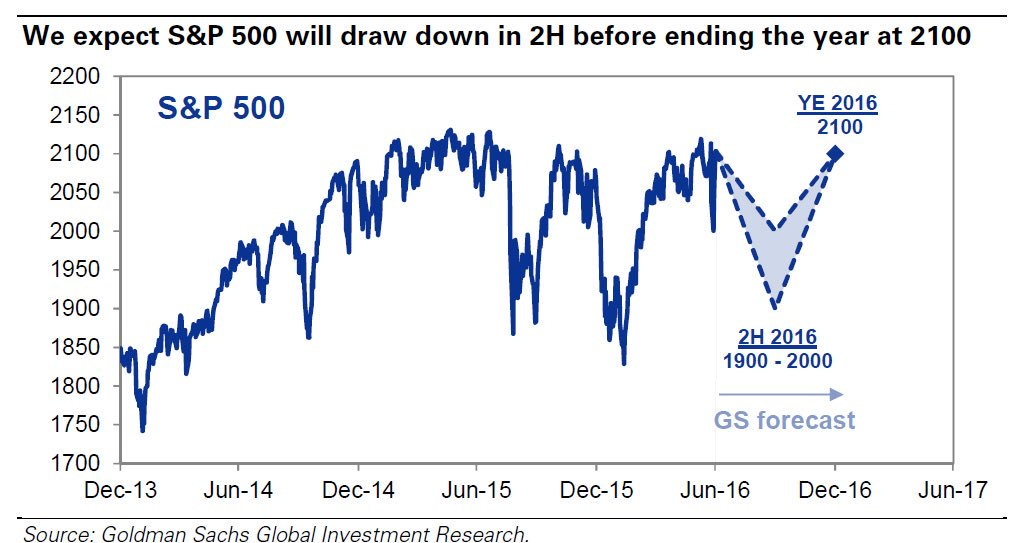
David B. Armstrong, CFA recently published a chart titled, “Who gives a Sh*t,” where he mocked the usefulness of any prediction that called for a downturn and subsequent rebound to the current market levels inside of 6 months. In an interview with the renowned market pundit, Phil MacCrackin, Armstrong said in his best imitation of Alec Baldwin from Glengarry Glen Ross, “Oh yeah, I used to be a market predictor, it’s a tough racket.”
Armstrong went on to say he aspires to one day hold a career where no matter what happens to a prediction in the market, it all works out. “It must be great. If the market goes down I can say I’m a freakin’ genius in my annual compensation review. If it stays the same, no one is really mad and I’ll get a raise. If the market goes up, I may be wrong but everyone is so happy that I’ll get a raise.” Armstrong said.
He then wondered off from the interview to get a selfie with S.E Cupp mumbling something like, “If ‘ifs’ and ‘buts’ were candy and nuts, life would be a fruit cake.”
Because really, are we gonna get all twisted up over making 3-6 month forecasts? REALLY!? Let me show you something I’m much more confident in…something that will add some value. Did you miss the great blog from last week where I discussed the chart below in great detail?
Why in the world would anyone in the proper frame of mind for investing give a rat’s nest about a prediction of a pullback only to recover by the end of the year?
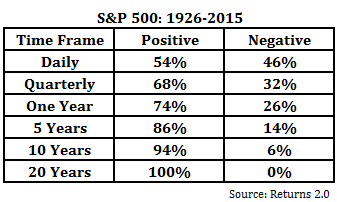
How about this – LOOK AT THE PROBABILITY OF THE MARKET BEING POSITIVE OVER 5, 10 AND 20 YEAR TIME FRAMES!!!!!! I ask anyone, do you really care about trying to GUESS the outcome of the next 6 months?
Okay, now in fairness, that chart is probably trying to show that there is a possibility of some serious volatility over the next 6 months, even though the creator feels like the market won’t end DOWN by the end of the calendar year. But still…
Understand the importance of taking the dips in stride by reading a recent blog where I review the importance of time and the length of previous bull markets.
Oil Spill
Holy gas prices, Batman. It’s unusual for gas prices to make a big drop in the summer. (Peak usage: boats, vacation travel in cars, starting beach bonfires, etc.) As of August 1st, the average price of regular gasoline in the U.S. was $2.16 per gallon, down from a June 13th peak of $2.40, according to the Energy Information Administration.
It’s a windfall for all drivers and companies that use plenty of fuel, but it puts added pressure on the energy industry (as discussed above). There are two big things impacting oil prices: the fundamentals and the U.S. Dollar (USD).
First, the fundamentals.
- OPEC oil output in July probably hit its highest level since 1997 (Reuters survey)…so lots of oil. See the Bespoke chart below.
- The recent gains above $50 per barrel encouraged an uptick in the U.S. oil rig count, which could bring new supply to the market. See the same chart below.
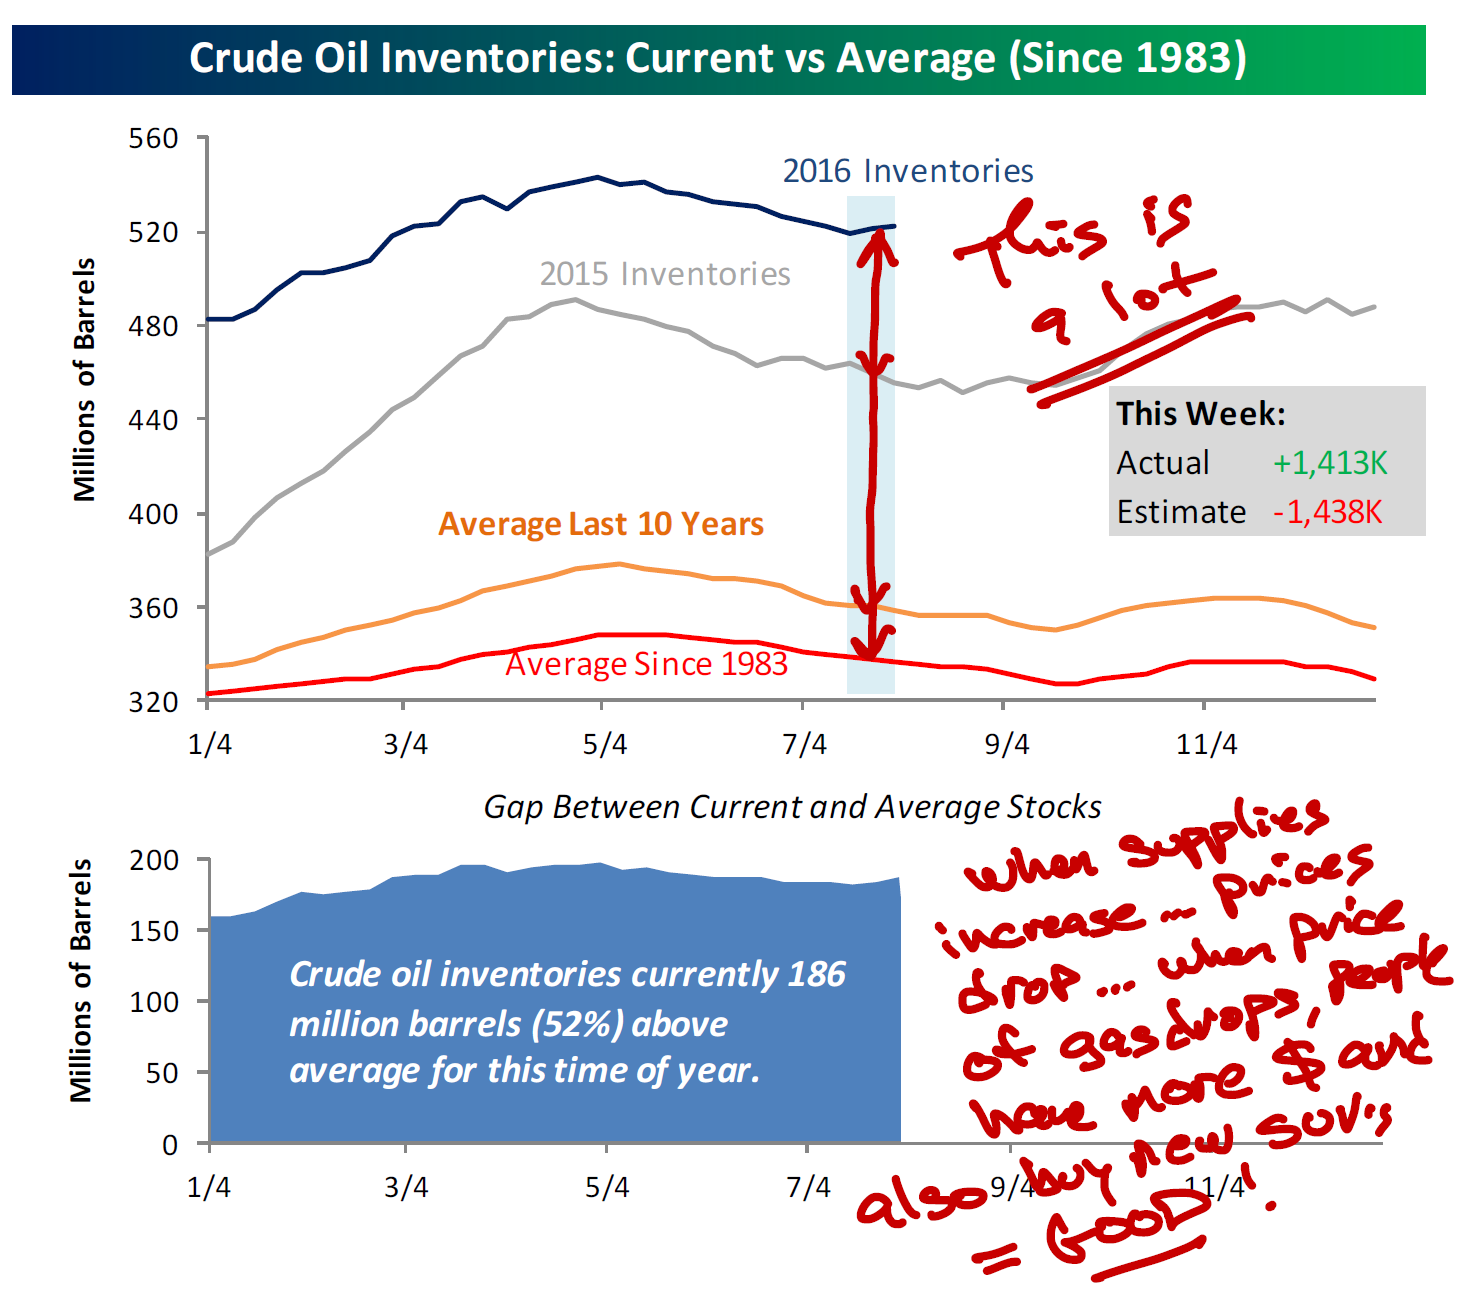
- U.S gasoline demand this summer may not be as strong as it had been forecasted, which may account for why the inventories are so high.
- According to Reuters, there is also a glut of gasoline in addition to all this oil.
Though you are not hearing much about it, this from John Kemp, Senior Energy Analyst at Thomson Reuters:
“Oil-exporting countries accounted for more than one-third of the global increase in oil consumption outside the United States between 2004 and 2014. Their economies have slowed or gone into recession, removing one of the most dynamic drivers of oil demand.”
However, there is also the recent strength in the USD. Why is that important? When oil is sold around the globe, it is sold in USD. So in theory, a stronger USD should pressure a commodity that is priced and sold in dollars. You can see this in the chart and data below from Charles Sherry.
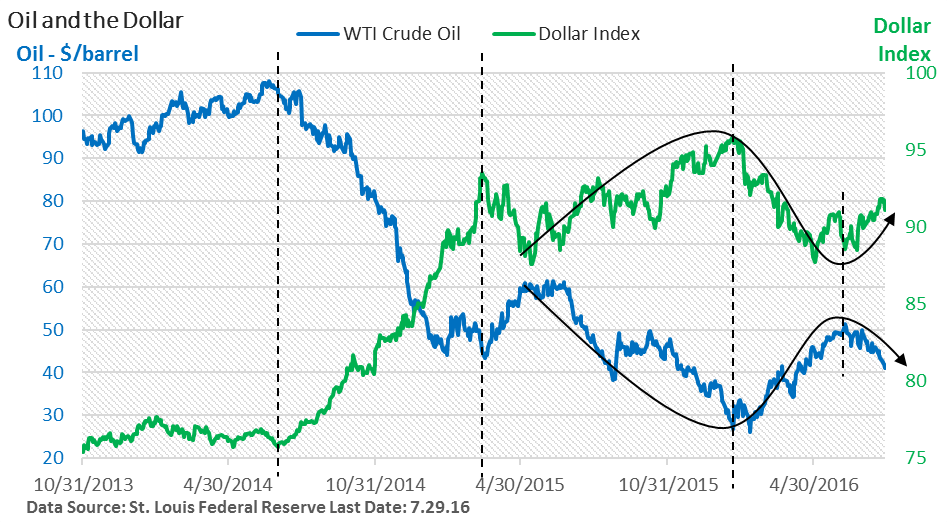
Note: The Dollar Index is a trade-weighted, unmanaged basket of currencies of major U.S. trading partners. It cannot be invested into directly. Past performance does not guarantee future results. Blah blah blah…disclaimer disclaimer disclaimer…
The inverse correlation between the USD and the price of oil is not perfect, but it’s pretty darn close. As the USD peaked early in the year, oil soon began to rally. And a late spring bounce in the USD was soon followed by a downturn in the price of crude oil.
Also, don’t overlook the collapse in oil prices that started in 2014 and was tied to the long upward march of the USD.
Over the last 15 years, data show that oil typically declines in price right after summer ends and fall begins. Oil may or may not follow its historical pattern, but what happens to the USD seems likely to exert a considerable amount of influence over oil going forward.
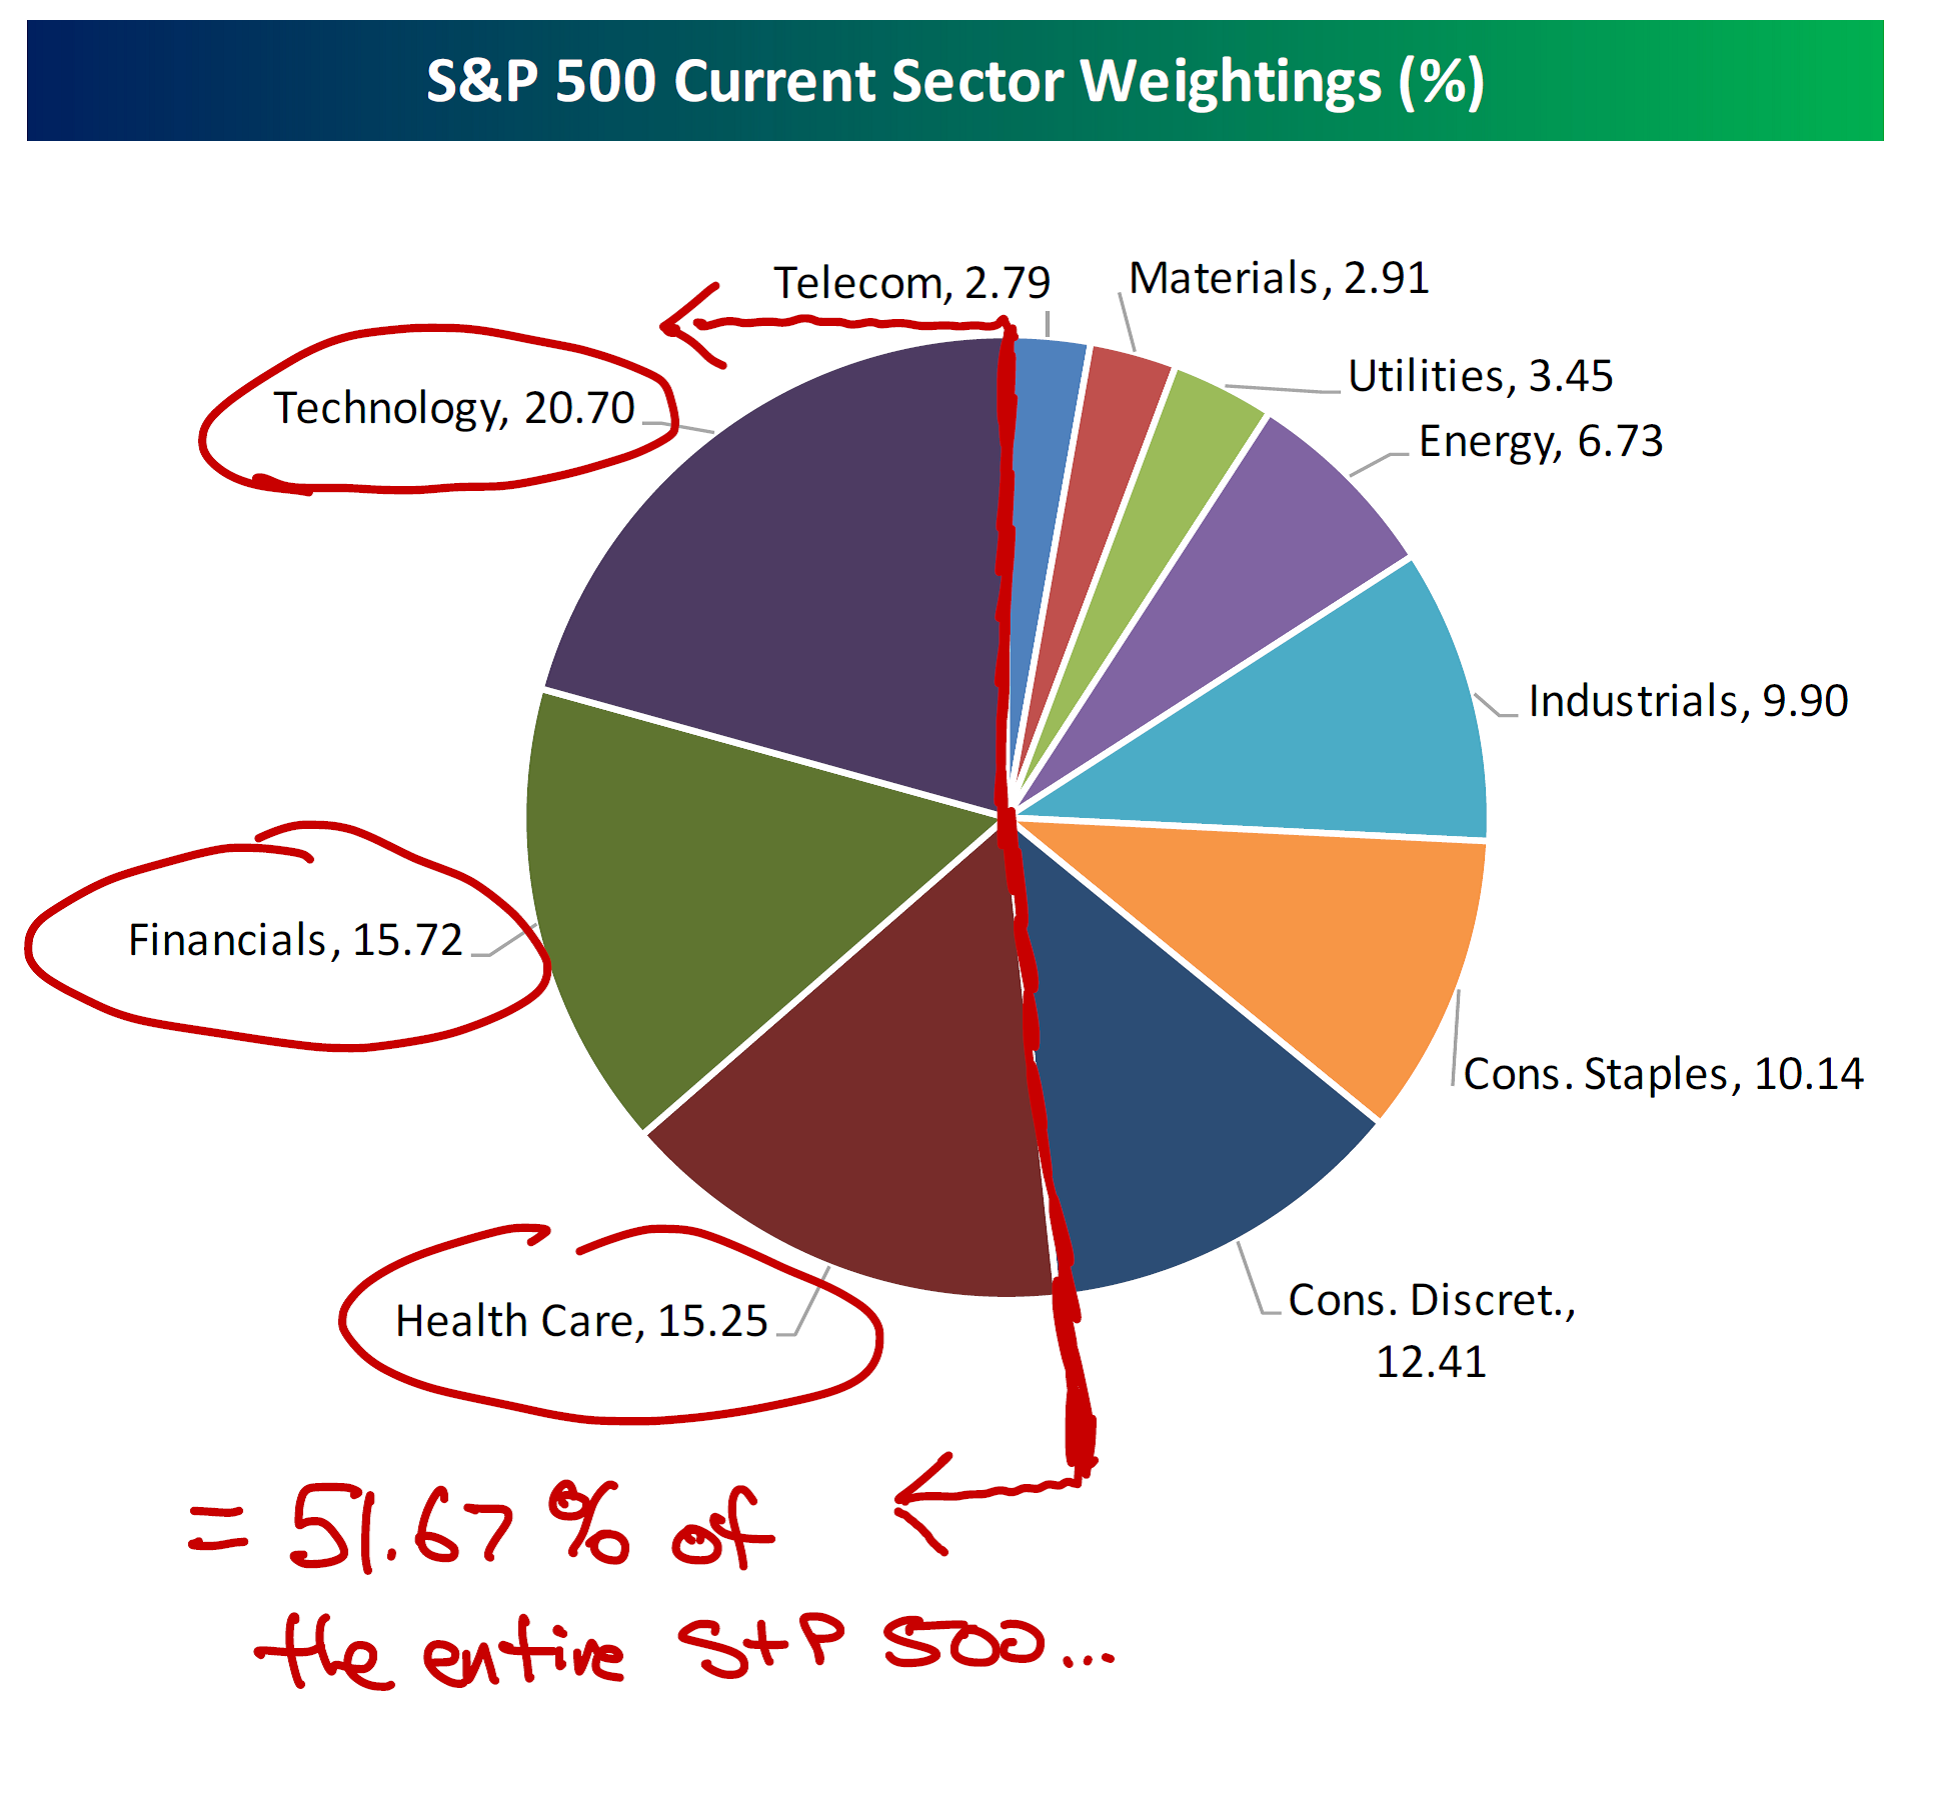
I’m still in the camp that while low oil prices are bad for energy companies, low oil prices help a lot of other companies and sectors…not to mention the 70% of the economy driven by the consumer with more money in their pockets to buy cars and houses.
Take a look at how the 10 sectors of the S&P 500 are weighted in this Bespoke chart. Energy is at 6.73%, and I don’t see how low oil prices can really hurt the three sectors that make up 51.67% of the whole S&P 500.
Stay well diversified, have a plan and don’t play the guessing game.
Please call or email with questions.
Important Disclosure Information for “Why Earnings, Charts and Oil are Important to You Right Now.”
Please remember that past performance may not be indicative of future results. Different types of investments involve varying degrees of risk, and there can be no assurance that the future performance of any specific investment, investment strategy, or product (including the investments and/or investment strategies recommended or undertaken by Monument Wealth Management), or any non-investment related content, made reference to directly or indirectly in this blog will be profitable, equal any corresponding indicated historical performance level(s), be suitable for your portfolio or individual situation, or prove successful. All indexes referenced are unmanaged and cannot be invested into directly. The economic forecasts set forth may not develop as predicted. Due to various factors, including changing market conditions and/or applicable laws, the content may no longer be reflective of current opinions or positions. Moreover, you should not assume that any discussion or information contained in this blog serves as the receipt of, or as a substitute for, personalized investment advice from Monument Wealth Management. To the extent that a reader has any questions regarding the applicability of any specific issue discussed above to his/her individual situation, he/she is encouraged to consult with the professional advisor of his/her choosing. Monument Wealth Management is neither a law firm nor a certified public accounting firm and no portion of the blog content should be construed as legal or accounting advice. A copy of Monument Wealth Management’s current written disclosure statement discussing our advisory services and fees is available for review upon request.


David B. Armstrong, CFA
President & Co-Founder
Dave got into the industry when he discovered his passion for finance in his mid-20’s. He’s a combat veteran and served as an officer in the United States Marines Corps on both active duty and in the reserves, retiring at the rank of Lieutenant Colonel. While serving on active duty, Dave was unable to spend money on deployments, so he became a self-taught investor. Along with a few bucks cash as a bouncer, his investing performance grew to be good....
IMPORTANT DISCLOSURE INFORMATION
Please remember that past performance is no guarantee of future results. Different types of investments involve varying degrees of risk, and there can be no assurance that the future performance of any specific investment, investment strategy, or product (including the investments and/or investment strategies recommended or undertaken by Monument Capital Management, LLC [“Monument”]), or any non-investment related content, made reference to directly or indirectly in this blog will be profitable, equal any corresponding indicated historical performance level(s), be suitable for your portfolio or individual situation, or prove successful. Due to various factors, including changing market conditions and/or applicable laws, the content may no longer be reflective of current opinions or positions. Moreover, you should not assume that any discussion or information contained in this blog serves as the receipt of, or as a substitute for, personalized investment advice from Monument. To the extent that a reader has any questions regarding the applicability of any specific issue discussed above to his/her individual situation, he/she is encouraged to consult with the professional advisor of his/her choosing. No amount of prior experience or success should be construed that a certain level of results or satisfaction will be achieved if Monument is engaged, or continues to be engaged, to provide investment advisory services. Monument is neither a law firm nor a certified public accounting firm and no portion of the blog content should be construed as legal or accounting advice.
A copy of the Monument’s current written disclosure Brochure discussing our advisory services and fees is available for review upon request or at www.monumentwealthmanagement.com/disclosures. Please Note: Monument does not make any representations or warranties as to the accuracy, timeliness, suitability, completeness, or relevance of any information prepared by any unaffiliated third party, whether linked to Monument’s website or blog or incorporated herein, and takes no responsibility for any such content. All such information is provided solely for convenience purposes only and all users thereof should be guided accordingly.
Historical performance results for investment indices, benchmarks, and/or categories have been provided for general informational/comparison purposes only, and generally do not reflect the deduction of transaction and/or custodial charges, the deduction of an investment management fee, nor the impact of taxes, the incurrence of which would have the effect of decreasing historical performance results. It should not be assumed that your Monument account holdings correspond directly to any comparative indices or categories. Please Also Note: (1) performance results do not reflect the impact of taxes; (2) comparative benchmarks/indices may be more or less volatile than your Monument accounts; and, (3) a description of each comparative benchmark/index is available upon request.
Please Remember: If you are a Monument client, please contact Monument, in writing, if there are any changes in your personal/financial situation or investment objectives for the purpose of reviewing/evaluating/revising our previous recommendations and/or services, or if you would like to impose, add, or to modify any reasonable restrictions to our investment advisory services. Unless, and until, you notify us, in writing, to the contrary, we shall continue to provide services as we do currently. Please Also Remember to advise us if you have not been receiving account statements (at least quarterly) from the account custodian.