Explore Our
“Off The Wall” Blog
Unique, straight-forward, unfiltered opinion on topics of concern for individuals with newfound wealth.
What One Economic Indicator is Saying About an Upcoming Recession
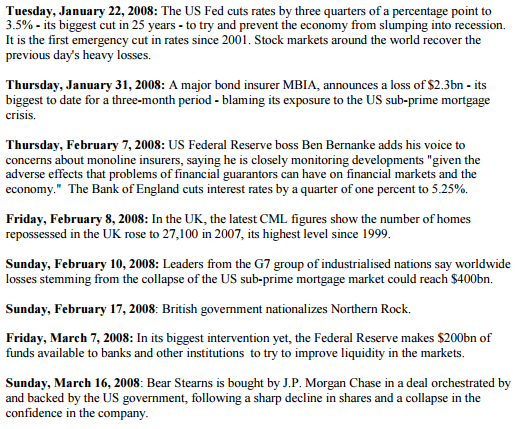
First – a look back at what was happening in 2008. I thought this was a pretty interesting clip from the University of Pennsylvania.
I have more thoughts on news and headlines below but first I want to transition to one of the leading economic indicators I like to keep a sharp eye on…the Department of Labor’s Weekly Initial Jobless Claims for Unemployment Insurance. This report is often referred to as simply the “Jobless Claims” since the official title is a mouthful.
If this is ringing a bell then it is because I have written about it before…way back in October.
Since it is released weekly, it is always very timely. If there is one downside it is that it can really bounce around week-to-week. On the upside, it is not only a gauge of the labor market, but it is also a good measure of how well the economy is performing. Below shows the data as of February 4th, 2017.
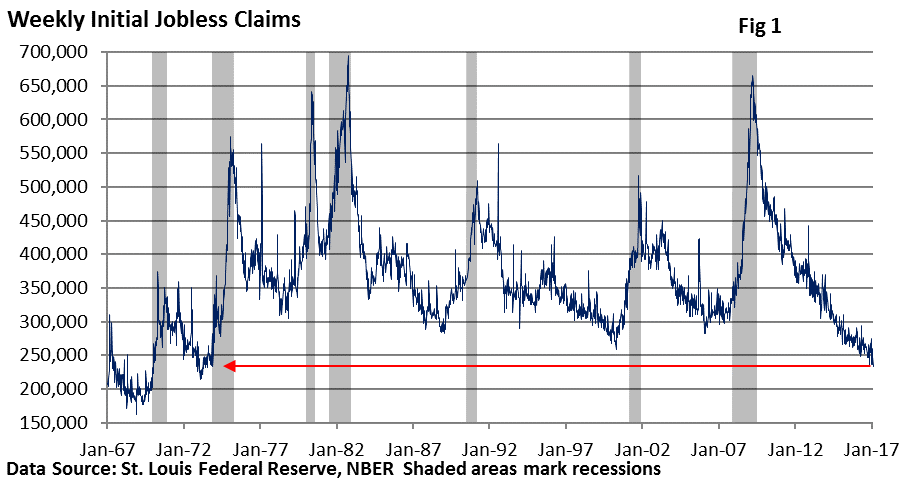
As you can see, layoffs are at low levels and people are not filing for unemployment insurance. I think these low levels are a strong signal that business activity/sales are expanding and companies are reluctant to lose workers.
Now, if the opposite were true and the general level of first-time jobless claims was on the rise, it would be a sign that business conditions are sluggish or worse, deteriorating.
In other words, I think Jobless Claims are a solid measure of business confidence, as it is a reflection of what is happening and what is expected to happen in the economy.
So back to the chart…note by looking at the red line that claims are at the lowest level since the early 1970s.
Lowest. Level. Since. 1970s.
As if that were not enough, notice that claims tick higher as a recession approaches. This is seen by the blue line going up prior to a grey shaded area that denotes a recession.
See how that is NOT happening now?
Right…in fact, claims can bottom anywhere from one to two years PRIOR to the onset of a recession. At least that has been the case in most recessions going back to 1970. You can see that here by looking at the red arrows.

New Highs & Earnings
Why am I highlighting Jobless Claims? Because shares in the major U.S. indexes closed at new highs on Friday lifted by both corporate earnings and the potential for tax cuts.
Stocks have been on a march upward since the election and I believe that this is based largely on the expectation that tax cuts will lift corporate profits. While there has certainly been a great deal of political uncertainty here at home and in Europe, investors continue to look at faster earnings growth, modest U.S. economic growth, and expectations that both will continue.
Not only has the market been on a strong march upward since the election, it has also been remarkably…stable. Last Friday marked 159 trading days since the S&P 500 has had a 5% decline. This is the longest streak of the current bull market.
What’s the second longest? 158 trading days that ended in September 2014.
In fact it’s been 84 days (through last Friday) since we have had our last 1% decline.
It has left investors (and, candidly, advisors as well) who are sitting on cash with little opportunity to get in.
So what gives? Well, I think it is the tailwinds from the economy and rising profits that have offset headwinds from any political uncertainty. While we cannot rule out the possibility of more volatility (we never can), longer-term, the fundamentals such as earnings have historically dictated the direction of stock prices.
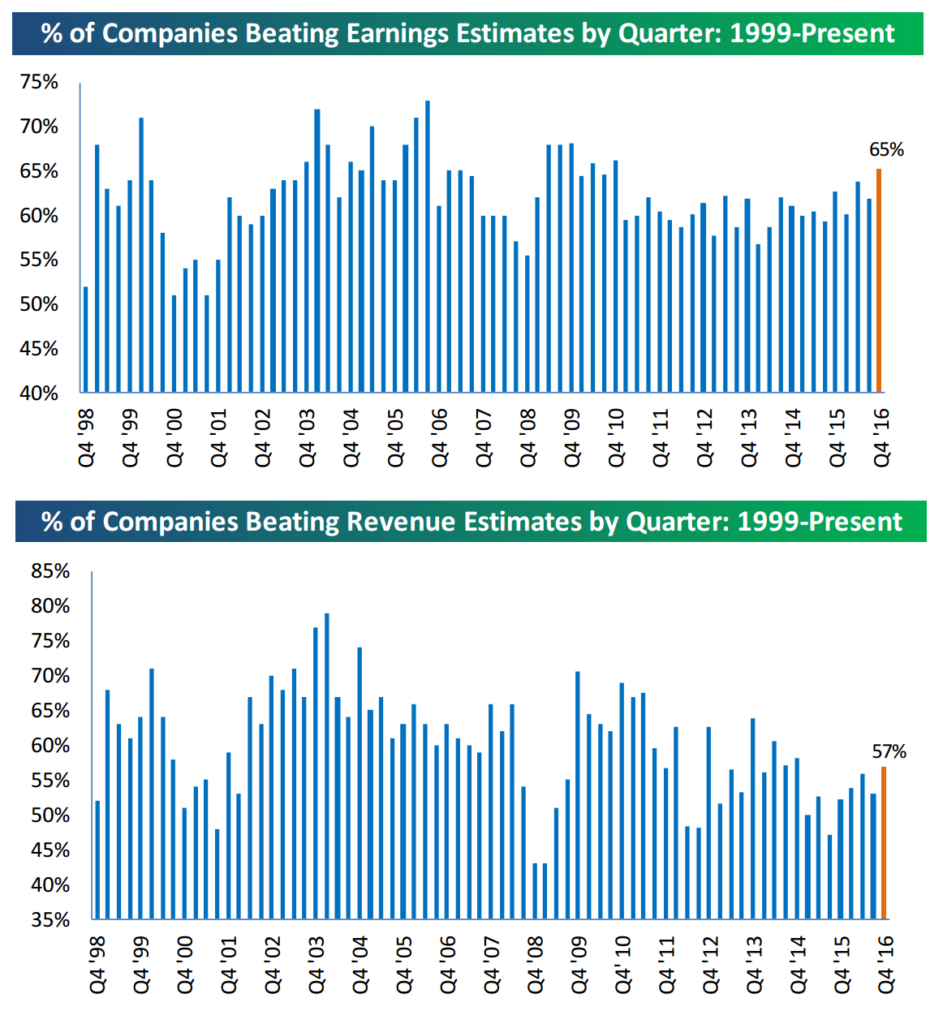
Speaking of earnings…we have had over 1,100 companies report their Q4 2016 earnings numbers. That leaves us with about a week and a half to go before unofficially coming to an end on February 21st when Wal-Mart reports. Remember, since companies report all throughout the year, the season unofficially starts with Alcoa and ends with Wal-Mart. Barring an Executive Order changing that, it will always be that way.
As of now, 65% of companies that have reported have beaten consensus analyst earnings per share estimates. It’s referred to as the “Beat Rate.” If it stays at this level for the next 10 days, a 65% beat rate would be the strongest reading since Q3 2010.
That’s a big deal in my book if it holds.
The revenue estimate beat rate is coming in at 57%. While that is not as good as the earnings beat rate, it would be the strongest reading since Q4 2014.
Just remember that while earnings are coming in strong, the press will always remind you of some crisis. Below from Bespoke is most of the 2016 calendar year with some of the year’s headlines. You can find lots of reasons to “sell based on bad news” in the graphic below.
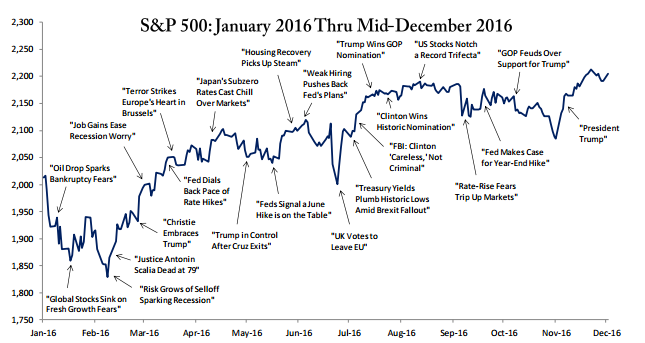
Just remember this…
No one has any facts about the future…just opinions. And while opinions are fun and not without merit, don’t get convinced they are facts. Only charlatans and fools believe they know facts about the future.
Which Leads Us to Recession Talk
Bottom Line – While there is always a possibility of a recession, I think the Jobless Claims suggest that the probability of a recession anytime over the next 12 months is very, very low.
Call with questions.

Important Disclosure Information
Please remember that past performance may not be indicative of future results. Different types of investments involve varying degrees of risk, and there can be no assurance that the future performance of any specific investment, investment strategy, or product (including the investments and/or investment strategies recommended or undertaken by Monument Wealth Management), or any non-investment related content, made reference to directly or indirectly in this blog will be profitable, equal any corresponding indicated historical performance level(s), be suitable for your portfolio or individual situation, or prove successful. All indexes referenced are unmanaged and cannot be invested into directly. The economic forecasts set forth may not develop as predicted. Due to various factors, including changing market conditions and/or applicable laws, the content may no longer be reflective of current opinions or positions. Moreover, you should not assume that any discussion or information contained in this blog serves as the receipt of, or as a substitute for, personalized investment advice from Monument Wealth Management. To the extent that a reader has any questions regarding the applicability of any specific issue discussed above to his/her individual situation, he/she is encouraged to consult with the professional advisor of his/her choosing. Monument Wealth Management is neither a law firm nor a certified public accounting firm and no portion of the blog content should be construed as legal or accounting advice. A copy of Monument Wealth Management’s current written disclosure statement discussing our advisory services and fees is available for review upon request.

David B. Armstrong, CFA
President & Co-Founder
Dave got into the industry when he discovered his passion for finance in his mid-20’s. He’s a combat veteran and served as an officer in the United States Marines Corps on both active duty and in the reserves, retiring at the rank of Lieutenant Colonel. While serving on active duty, Dave was unable to spend money on deployments, so he became a self-taught investor. Along with a few bucks cash as a bouncer, his investing performance grew to be good....
IMPORTANT DISCLOSURE INFORMATION
Please remember that past performance is no guarantee of future results. Different types of investments involve varying degrees of risk, and there can be no assurance that the future performance of any specific investment, investment strategy, or product (including the investments and/or investment strategies recommended or undertaken by Monument Capital Management, LLC [“Monument”]), or any non-investment related content, made reference to directly or indirectly in this blog will be profitable, equal any corresponding indicated historical performance level(s), be suitable for your portfolio or individual situation, or prove successful. Due to various factors, including changing market conditions and/or applicable laws, the content may no longer be reflective of current opinions or positions. Moreover, you should not assume that any discussion or information contained in this blog serves as the receipt of, or as a substitute for, personalized investment advice from Monument. To the extent that a reader has any questions regarding the applicability of any specific issue discussed above to his/her individual situation, he/she is encouraged to consult with the professional advisor of his/her choosing. No amount of prior experience or success should be construed that a certain level of results or satisfaction will be achieved if Monument is engaged, or continues to be engaged, to provide investment advisory services. Monument is neither a law firm nor a certified public accounting firm and no portion of the blog content should be construed as legal or accounting advice.
A copy of the Monument’s current written disclosure Brochure discussing our advisory services and fees is available for review upon request or at www.monumentwealthmanagement.com/disclosures. Please Note: Monument does not make any representations or warranties as to the accuracy, timeliness, suitability, completeness, or relevance of any information prepared by any unaffiliated third party, whether linked to Monument’s website or blog or incorporated herein, and takes no responsibility for any such content. All such information is provided solely for convenience purposes only and all users thereof should be guided accordingly.
Historical performance results for investment indices, benchmarks, and/or categories have been provided for general informational/comparison purposes only, and generally do not reflect the deduction of transaction and/or custodial charges, the deduction of an investment management fee, nor the impact of taxes, the incurrence of which would have the effect of decreasing historical performance results. It should not be assumed that your Monument account holdings correspond directly to any comparative indices or categories. Please Also Note: (1) performance results do not reflect the impact of taxes; (2) comparative benchmarks/indices may be more or less volatile than your Monument accounts; and, (3) a description of each comparative benchmark/index is available upon request.
Please Remember: If you are a Monument client, please contact Monument, in writing, if there are any changes in your personal/financial situation or investment objectives for the purpose of reviewing/evaluating/revising our previous recommendations and/or services, or if you would like to impose, add, or to modify any reasonable restrictions to our investment advisory services. Unless, and until, you notify us, in writing, to the contrary, we shall continue to provide services as we do currently. Please Also Remember to advise us if you have not been receiving account statements (at least quarterly) from the account custodian.