Explore Our
“Off The Wall” Blog
Unique, straight-forward, unfiltered opinion on topics of concern for individuals with newfound wealth.
Dresses, Llamas and about 1,000 points on the Dow.

Quietly, February was a month in which the Dow went from an opening index level of 17,170 to close at 18,132…making it a great month for stocks. It’s as if a Stealth Bomber flew over and dropped 963 points on the Dow and no one saw it come or go.
The Dow ended up 37 points shy of being a 1,000 point month. If Friday had eked out 38 points, it would have only been the third month in history to gain 1,000 points.
The last time the Dow gained 1000 points in a month? October of 2011.
It was good to see that through all kinds of distractions, like oil, Greece, the Fed, important debates about the color of a dress and an OJ Simpson-like coverage of two llamas on the loose, U.S. stocks indices were able to power higher across the board.
Inflation and Disinflation
The Consumer Price Index (CPI) fell 0.7% in January. This equates to an annual decline of 0.1%, meaning that technically, the U.S. has slipped into a period of deflation.
But let’s not get all worked up into a lather over this issue since the steep decline in oil and gasoline prices we have seen since last summer is pretty much responsible for the drop in the CPI… the energy portion of the index fell 9.7% and the gasoline portion of the index fell 18.7% in January. January was the sharpest in a series of seven consecutive monthly declines. I wrote about disinflation in the face of declining oil and gas prices in the very first paragraph of this blog from early February, 2015.
So let’s look at what is referred by economists and smarty pants people at cocktail parties as the Core CPI. (The regular CPI is sometimes referred to as “Headline CPI” since it, well, it grabs the headline.) The Core CPI excludes the volatile energy and food components of the Headline CPI. In January, Core CPI rose 0.2% versus December, and is up 1.6% versus one year ago.
That Core CPI reading is also unchanged from December’s reading of 1.6%. In fact, it’s been fairly steady over the last couple of years. See the chart below and take note of the red line.
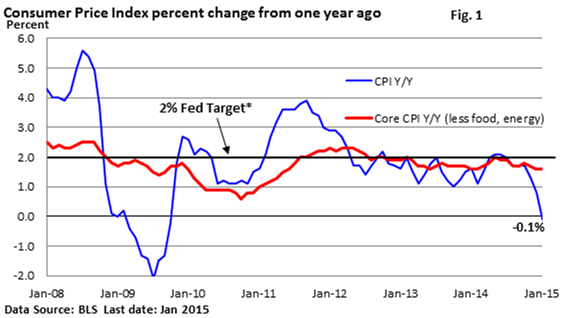
Here’s my thinking: oil prices can’t fall forever. So because of that, we’re likely to see the headline CPI eventually back turn positive (and it’s BARELY negative). Along with what we are seeing is what we are not seeing, and that is falling gasoline prices have failed to flow through to the Core CPI because an expanding economy translates into stronger sales at many firms.
Who cuts prices when business is growing?
Also, this ties into the Fed and when they are going to raise interest rates. Core inflation is at 1.6%, which is historically pretty low… and that is something the Fed pays attention to.
CLOSE ATTENTION.
Why? Because price stability is a critical element of monetary policy. It not only permits companies to better plan for the long run, but it helps people living on fixed incomes to plan better, as well.
Last week, Fed Chief Janet Yellen testified before two Congressional committees on the economic outlook and monetary policy. Without boring you with the details of her speech, she basically said that central bankers want to see inflation moving towards its 2% target before it hikes rates.
Now for those of you who are inclined to try to time the Fed and their first raise, I offer you this handy cheat sheet from Bespoke.
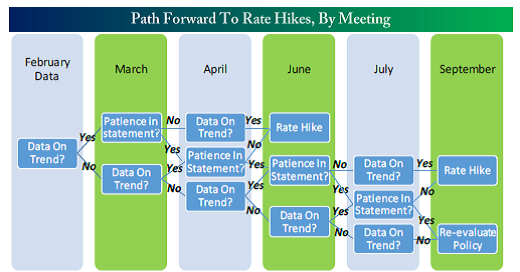
You see, figuring out the path to a rate hike should be no problem… (insert sarcasm).
Warning to investors (i.e. the opposite of traders… and if you are reading this, you are not a trader and if you are a trader you probably suck at it anyway)… DON’T TRY TO TIME ANY OF THIS.
Earnings Season
Earnings season has (unofficially) come to an end and over 1,500 companies have reported their earnings and revenue for the fourth quarter (4Q) of 2014. According to Bespoke, here’s how we ended up:
- The percentage of companies beating their revenue estimates for the 4Q finished at 58.1%, which is slightly below the average of 60% that we’ve seen since 2001, but above the 57.2% that finished up the 3Q of 2014. Since the revenue readings bottomed out in the 4Q of 2011, quarter-over-quarter readings ping pong but the trend has been positive for revenues.
- The percentage of companies beating their earnings estimates finished at 61.1%, which is slightly below the average of 62% dating back to 1998, and the 62.1% final reading from the 3Q of 2014.
Bespoke also publishes a chart that shows the spread between companies guiding future earnings higher or lower on a percentage basis. Up until the 1Q of 2014, the spread had been negative for the TEN previous quarters, meaning there are more companies stating they will earn less in the upcoming quarter than the same quarter a year prior. That’s 2.5 years of pessimism coming out of corporate America.
After two flat quarters in the 1Q and 2Q of 2014, we saw the 3Q revert back to a negative reading. The final reading for the 4Q of 2014 shows the spread between companies posting negative guidance versus companies posting positive guidance in the 4Q was a whopping -9.4%! This was the worst spread reading since the last two quarters of the 2008.

Important Disclosure Information
Please remember that past performance may not be indicative of future results. Different types of investments involve varying degrees of risk, and there can be no assurance that the future performance of any specific investment, investment strategy, or product (including the investments and/or investment strategies recommended or undertaken by Monument Wealth Management), or any non-investment related content, made reference to directly or indirectly in this blog will be profitable, equal any corresponding indicated historical performance level(s), be suitable for your portfolio or individual situation, or prove successful. Due to various factors, including changing market conditions and/or applicable laws, the content may no longer be reflective of current opinions or positions. Moreover, you should not assume that any discussion or information contained in this blog serves as the receipt of, or as a substitute for, personalized investment advice from Monument Wealth Management. To the extent that a reader has any questions regarding the applicability of any specific issue discussed above to his/her individual situation, he/she is encouraged to consult with the professional advisor of his/her choosing. Monument Wealth Management is neither a law firm nor a certified public accounting firm and no portion of the blog content should be construed as legal or accounting advice. A copy of Monument Wealth Management’s current written disclosure statement discussing our advisory services and fees is available for review upon request.

David B. Armstrong, CFA
President & Co-Founder
Dave got into the industry when he discovered his passion for finance in his mid-20’s. He’s a combat veteran and served as an officer in the United States Marines Corps on both active duty and in the reserves, retiring at the rank of Lieutenant Colonel. While serving on active duty, Dave was unable to spend money on deployments, so he became a self-taught investor. Along with a few bucks cash as a bouncer, his investing performance grew to be good....
IMPORTANT DISCLOSURE INFORMATION
Please remember that past performance is no guarantee of future results. Different types of investments involve varying degrees of risk, and there can be no assurance that the future performance of any specific investment, investment strategy, or product (including the investments and/or investment strategies recommended or undertaken by Monument Capital Management, LLC [“Monument”]), or any non-investment related content, made reference to directly or indirectly in this blog will be profitable, equal any corresponding indicated historical performance level(s), be suitable for your portfolio or individual situation, or prove successful. Due to various factors, including changing market conditions and/or applicable laws, the content may no longer be reflective of current opinions or positions. Moreover, you should not assume that any discussion or information contained in this blog serves as the receipt of, or as a substitute for, personalized investment advice from Monument. To the extent that a reader has any questions regarding the applicability of any specific issue discussed above to his/her individual situation, he/she is encouraged to consult with the professional advisor of his/her choosing. No amount of prior experience or success should be construed that a certain level of results or satisfaction will be achieved if Monument is engaged, or continues to be engaged, to provide investment advisory services. Monument is neither a law firm nor a certified public accounting firm and no portion of the blog content should be construed as legal or accounting advice.
A copy of the Monument’s current written disclosure Brochure discussing our advisory services and fees is available for review upon request or at www.monumentwealthmanagement.com/disclosures. Please Note: Monument does not make any representations or warranties as to the accuracy, timeliness, suitability, completeness, or relevance of any information prepared by any unaffiliated third party, whether linked to Monument’s website or blog or incorporated herein, and takes no responsibility for any such content. All such information is provided solely for convenience purposes only and all users thereof should be guided accordingly.
Historical performance results for investment indices, benchmarks, and/or categories have been provided for general informational/comparison purposes only, and generally do not reflect the deduction of transaction and/or custodial charges, the deduction of an investment management fee, nor the impact of taxes, the incurrence of which would have the effect of decreasing historical performance results. It should not be assumed that your Monument account holdings correspond directly to any comparative indices or categories. Please Also Note: (1) performance results do not reflect the impact of taxes; (2) comparative benchmarks/indices may be more or less volatile than your Monument accounts; and, (3) a description of each comparative benchmark/index is available upon request.
Please Remember: If you are a Monument client, please contact Monument, in writing, if there are any changes in your personal/financial situation or investment objectives for the purpose of reviewing/evaluating/revising our previous recommendations and/or services, or if you would like to impose, add, or to modify any reasonable restrictions to our investment advisory services. Unless, and until, you notify us, in writing, to the contrary, we shall continue to provide services as we do currently. Please Also Remember to advise us if you have not been receiving account statements (at least quarterly) from the account custodian.